AERMOD is the AMS/EPA Regulatory Model, and EPA publishes its regulatory applicability guidance as Appendix W to 40 CFR Part 51 [1]. The model takes an emission rate as an input, entered on the source parameter card as QS [1]. QS is simply the User’s Guide’s shorthand for the source’s emission rate in grams per second [1].
The model does not calculate that rate, and it has no way to check it. How much mass left the source is a separate question, usually answered somewhere else with an emission factor.
Quick Answer: AERMOD requires an emission rate as a source parameter, in grams per second, and does not calculate it [1]. Most rates are built from AP-42 emission factors, which EPA describes as averages of available data representing a population, not a specific facility [2]. The dispersion result inherits whatever uncertainty sits in that input.
What AERMOD Calculates, and What It Takes as Given
A regulatory AERMOD run draws on several groups of input, and only one of them describes the release itself. EPA’s guidance states that a modeling protocol should identify the model, the modeling options, and the input data, naming meteorology and emission source parameters [1]. The control file itself holds the modeling options, source location and parameter data, and receptor locations [1].
The source parameter card carries the physical description of the stack alongside the rate [1]. Each parameter has a two-letter name: QS is the emission rate in grams per second and HS is the stack height [1]. It also holds TS for exit temperature, VS for exit velocity, and DS for stack diameter [1]. Four of those five are measurable with a tape and a thermocouple.
| Source parameter | What it describes | Where the number comes from |
|---|---|---|
| HS | stack height | surveyed |
| DS | stack diameter | measured |
| TS | exit temperature | measured |
| VS | exit velocity | measured |
| QS | emission rate | estimated |
*Four of the five source parameters are read off the stack. The fifth is calculated somewhere else. *
The Rate Is the Only Input Nobody Measured
The emission rate is usually the only number in the control file that was estimated rather than observed. Stack height is surveyed, and meteorology arrives as a processed data set [1].
That asymmetry is easy to miss because everything arrives in the same control file. A modeled concentration is proportional to the rate that produced it.
The practical response is documentation rather than a different model. A protocol that records how each rate was derived lets a reviewer weigh the result properly. Naming the factor, its rating, and the activity data behind it costs little and travels with the file.
How Emission Rates Are Normally Built
The standard route is AP-42, and EPA states its general equation plainly [2]. Emissions equal the activity rate times the emission factor times one minus the overall emission reduction efficiency [2].
EPA defines it as the control device’s destruction efficiency multiplied by the capture efficiency of the control system [2]. The overall figure is not the device rating alone [2].
A flare rated at 98 per cent destruction that captures 90 per cent of the vent stream delivers 88 per cent. The ten points that never reached the flare are the part an inventory most often misses. EPA also names dispersion modeling and analysis as one of the purposes those inventories serve [2].
One pass through the arithmetic shows where a published factor becomes a rate. A natural gas boiler under 100 MMBtu per hour carries an uncontrolled NOx factor of 100 pounds per million standard cubic feet, rated B [3]. Firing 50 million standard cubic feet over a year gives 5,000 pounds of NOx. Spread across the 31,536,000 seconds in a year, that is 0.0719 grams per second.
| Step | Value |
|---|---|
| AP-42 factor, small boiler NOx, uncontrolled | 100 lb per million scf |
| Activity | 50 million scf per year |
| Overall reduction | none |
| Annual mass | 5,000 lb |
| Emission rate for QS | 0.0719 g/s |
That last figure is the whole output of the exercise, and it is the one number on the source parameter card nobody measured.
Most factors are arithmetic means taken over whatever acceptable-quality test data existed when the factor was compiled [2]. EPA treats the result as a long-term average across every facility in the category, which it calls a population average [2].
Half of All Sources Sit Above the Factor
Roughly half the sources in any category emit more than the factor assigned to it [2]. EPA puts it plainly, writing that “approximately half of the subject sources will have emission rates greater than the emission factor.” [2] The rest fall below, which is what averaging a range produces.
EPA therefore advises against setting a source-specific permit limit from a factor [2]. A limit placed at the factor would put half the affected sources out of compliance immediately [2].
A sampling problem sits on top of the averaging [2]. Test data skew toward equipment that was recently installed or thought to be running correctly [2]. EPA warns that either situation may bias the resulting factor [2]. A factor built mostly from well-behaved equipment describes well-behaved equipment.
What the A to E Rating Does Not Tell You
The rating says nothing about how far one facility sits from the factor. Every AP-42 factor carries one, running from A down to E [2]. It reflects how reliable the underlying tests were and how much representative data stood behind them [2].
The rating is not an error bar [2]. EPA calls the ratings subjective and says they imply no statistical error bounds or confidence intervals [2]. They rest largely on the judgment of the authors and reviewers who assigned them [2]. An A-rated factor remains a population average carrying no site-specific uncertainty.
Later work put numbers on the spread the rating does not carry [4]. Quantified uncertainty ranges run from 25 to 62 per cent for an A-rated factor to 82 to 92 per cent for an E [4]. Even the best-rated factors carry a range wide enough to matter at a fenceline receptor.
| AP-42 factor rating | Quantified uncertainty |
|---|---|
| A | 25 to 62 per cent |
| B | 45 to 75 per cent |
| C | 60 to 82 per cent |
| D | 69 to 86 per cent |
| E | 82 to 92 per cent |
*The rating describes how the factor was derived; the range describes how far a result built on it can sit from the truth. *
What a Measurement-Informed Rate Changes
AERMOD is already built to accept rates that move [1]. Source emission rates can be held constant or varied by month, season, hour-of-day, or season and hour-of-day [1]. The HOUREMIS keyword accepts a file of hourly emission rates for any subset of sources in a run [1]. The capability is there and mostly unused, because a single annual factor produces a single constant.
Upstream oil and gas emissions are a poor fit for a constant [5]. Wells cycled between shut-in and flowing periods drive correlated behavior across all downstream equipment [5]. A source that is large on an annual average is really bursts of much higher rate separated by periods of nothing [5]. Equipment operating in a failed state adds a second layer of that behavior [5].
When the Difference Actually Shows Up
The averaging period decides whether variability matters. A short-term standard evaluated at a fenceline receptor is sensitive to the worst hours, not the mean.
Three situations are worth flagging in a protocol. Permit modeling with receptors near a property boundary is the first. Facilities with atmospheric storage tanks are the second, and any intermittent source is the third.
Where the Rate Can Come From Instead
A measurement-informed rate is built from the facility rather than from a category. Colorado’s statewide study reconciled modeled source-level inventories against aerial measurement across every producing basin in the state [6]. Setting aside maintenance emissions, which the model does not represent, its measurement-informed total sits 52 per cent above the adjusted reported inventory [6]. That increment is attributed to failure events rather than to normal operation [6].
Compared against the full reported inventory instead, the same work puts the modeled statewide total at 1.47 times reported [6]. On either comparison the gap is the part a design-state factor does not carry.
Process simulation is one way to produce a rate with a time dimension [5]. The Mechanistic Air Emissions Simulator (MAES) is a physics-based simulator of that kind, not an AI or machine learning model [5]. Its output is a distribution of expected emission ranges rather than a single value [5].
TetraSoft’s MAES Platform is how an operator runs that simulation without building anything first. A facility’s equipment inventory, gas composition, and operating parameters go in through MAES Studio.
Results come back as a distribution rather than a single value, across the equipment a permit application has to characterize.
The platform also models the abnormal events a design-state factor omits, including stuck dump valves, pressure relief valve actuations, and thief hatch failures. Those episodes are what produce the worst modeled hour at a fenceline receptor.
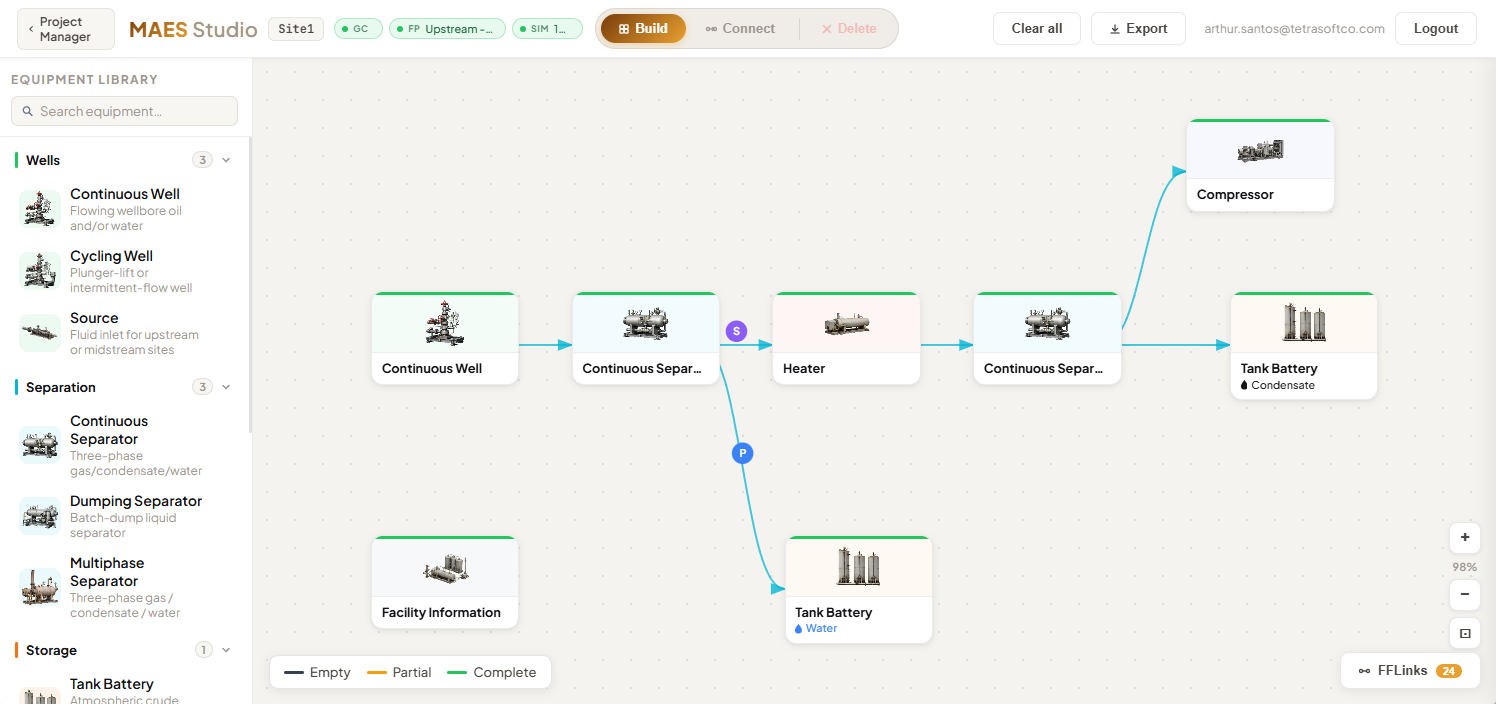
The simulation engine was developed at Colorado State University and the University of Texas at Austin, and TetraSoft licenses it from Colorado State.
The two models are complements rather than alternatives, and the seam between them is the emission rate [1]. AERMOD is a dispersion model that begins where the mass leaves the source, and it accepts the rate as given [1]. A mechanistic simulator works the other side of that boundary, producing the rate from equipment, operating conditions, and the states equipment actually occupies [5]. Nothing about running one displaces the other.
Where that matters most is the hourly file [1]. The HOUREMIS file takes hourly rates outright [1]. An annual AP-42 factor cannot fill that file, because it carries no time dimension to spread across 8,760 hours. What those factors do carry, and what each assumes, is set out in AP-42 Emission Factors by Source Type, and What They Assume.
A simulator that reports a distribution over time can fill it. MAES models equipment behavior at one-second temporal resolution, so the structure the hourly file needs already exists in the output. The resulting concentrations then reflect when the source was actually emitting.
That is the practical case for pairing them. The dispersion side of a permit application is well served by an established regulatory model. The rate feeding it is the part still estimated from a population average. That rate is also the part a reviewer is most likely to question.
A component-level version of the same argument is set out in Glycol Pumps: 90% of Uncontrolled TEG Dehydrator Emissions. The atmospheric side of the comparison appears in Why Satellites Show About 2x More Methane Than Inventories.
Frequently Asked Questions
Does AERMOD calculate emissions?
No [1]. AERMOD takes the emission rate as a user-supplied source parameter, entered as QS in grams per second on the source parameter card [1]. The model computes transport and dispersion from that release and predicts concentrations at receptors [1]. Producing the rate is a separate exercise done before the run.
What is the difference between an emission factor and an emission rate?
An emission factor relates pollutant quantity to an activity, such as mass of pollutant per unit of throughput [2]. An emission rate is mass per unit time, which is what AERMOD needs in grams per second [1]. The factor becomes a rate once multiplied by an activity level and adjusted for control efficiency [2]. The conversion is where a population average becomes a specific facility’s number.
What emission rate should I use in AERMOD?
The rate should follow whatever the reviewing agency’s approved modeling protocol specifies [1]. Source-specific test data generally describe a source better than a factor does [2]. EPA cautions that test results apply only to the conditions present during testing, so those conditions should be representative of routine operation [2]. Where no representative source-specific data exist, a factor is often the only option available [2].
Can AERMOD handle emissions that vary over time?
Yes, through two separate keywords [1]. EMISFACT applies variable emission factors to one source or a range of sources [1]. HOUREMIS reads one or more files of hourly rates covering some or all sources in a run [1]. The constraint is upstream, since a single annual factor cannot fill an hourly file.
Interested in building a Measurement-Informed Inventory for your operations? Contact us to learn about our MAES-based estimation services.
References
- EPA, User’s Guide for the AMS/EPA Regulatory Model (AERMOD), EPA-454/B-26-001, July 2026. United States Environmental Protection Agency, Air Quality Assessment Division. https://gaftp.epa.gov/Air/aqmg/SCRAM/models/preferred/aermod/aermod_userguide.pdf
- EPA AP-42, Introduction to AP-42 Volume I, Fifth Edition, January 1995. United States Environmental Protection Agency, Compilation of Air Pollutant Emission Factors. https://www.epa.gov/sites/default/files/2020-09/documents/c00s00.pdf
- Mollel et al., ACS ES&T Air 2025, 2, 723-735, DOI 10.1021/acsestair.4c00168. Using Prototypical Oil and Gas Sites to Model Methane Emissions in Colorado’s Denver-Julesburg Basin Using a Mechanistic Emission Estimation Tool. https://doi.org/10.1021/acsestair.4c00168
- Brown et al., Colorado Ongoing Basin Emissions (COBE) Updated Final Report, November 20, 2025. Colorado State University METEC and Colorado School of Mines, for the Colorado Department of Public Health and Environment. https://metec.colostate.edu/colorado-ongoing-basin-emissions-cobe/
- EPA AP-42 Chapter 1.4, Natural Gas Combustion, Table 1.4-1, April 2026. United States Environmental Protection Agency, Compilation of Air Pollutant Emission Factors. https://www.epa.gov/sites/default/files/2020-09/documents/1.4_natural_gas_combustion.pdf
- Pouliot et al., Quantification of emission factor uncertainty, Journal of the Air & Waste Management Association 62(3):287-298, 2012. George Pouliot, Emily Wisner, David Mobley and William Hunt Jr. https://doi.org/10.1080/10473289.2011.649155
This post is for informational purposes only and does not constitute legal or compliance advice. Consult qualified legal counsel or a compliance professional for guidance specific to your operations and jurisdiction.
Emission factor to AERMOD QS
AERMOD wants the source emission rate in grams per second. This does EPA's own AP-42 equation, activity times factor times one minus the overall reduction, then the unit conversion onto g/s. Enter the activity in the same unit as the factor's denominator: a factor in lb per million scf needs an activity in million scf.
Overall reduction is destruction multiplied by capture, not the device rating on its own. A flare rated at 98 per cent that captures 90 per cent delivers 88.2 per cent, and the gas that never reached it is the part an inventory misses.
| Factor times activity | 5,000 lb per year |
|---|---|
| Overall reduction applied | 0 per cent |
| Emission rate for QS | 0.07192 g/s |
If the factor carries an AP-42 quality rating, the published uncertainty for that rating is 45 to 75 per cent. That is a property of the factor, not an error bar on this facility, so it is shown beside the answer and never multiplied into it.
Comments
0Share your thoughts. All comments are moderated before appearing.
No comments yet. Be the first to share your thoughts!