Three greenhouse gases account for almost all of an oil and gas operation’s reported total. Methane (CH4) arrives from venting and leaks, carbon dioxide (CO2) from combustion and from the gas itself, and nitrous oxide (N2O) from combustion.
Reporting adds them together as carbon dioxide equivalent, which requires a conversion factor per gas [1]. That factor is not a constant, and the value a programme requires changes the reported total [2]. The published 100-year values for methane run from 25 to 30, a fifth apart, without a molecule changing. The natural gas unit converter converts a methane or nitrous oxide mass to CO2 equivalent against whichever basis you pick.
Quick Answer: Oil and gas operations emit mainly methane, carbon dioxide and nitrous oxide. Reported totals are summed as CO2 equivalent using 100-year global warming potentials [1]. Methane’s value is 25 under AR4, 28 under AR5 and 27.0 under AR6 for non-fossil sources, and 30 or 29.8 for fossil sources [2]. The EPA reporting programme moved to the revised values effective 1 January 2025 [1].
Which Greenhouse Gases Oil and Gas Operations Emit
The three gases arrive by different routes, which is why they behave differently in an inventory.
They are the three a greenhouse gas inventory counts, not everything an operation releases. The same streams carry ethane and heavier hydrocarbons, which the median Colorado analysis puts at 12.46% ethane alone [3]. Benzene, toluene, ethylbenzene and xylene travel with them and are regulated as hazardous air pollutants under a separate rule [4]. Those are counted by air-quality programmes rather than converted to CO2 equivalent. Methane is the produced product itself, so any path from the pressurised system to the atmosphere emits it. Carbon dioxide arrives twice over, once from burning fuel and once because it is already dissolved in the produced gas.
Nitrous oxide is the smallest of the three and the least discussed. It forms in engine and heater exhaust rather than from the produced stream. Its very high conversion factor is what keeps it in the reporting tables at all.
| Gas | Where it comes from in upstream operations | Scales with |
|---|---|---|
| Methane | Venting, fugitive leaks, incomplete combustion | Equipment counts and operating time |
| Carbon dioxide | Combustion exhaust, and CO2 already in the produced gas | Fuel burned and gas composition |
| Nitrous oxide | Combustion exhaust | Fuel burned |
Two of the three scale with equipment and fuel; only carbon dioxide also depends on what the reservoir produced.
Carbon Dioxide Is Already in the Gas
Produced gas arrives at the surface carrying carbon dioxide before anything is burned [3]. The filed analyses sit in TetraSoft Atlas, our subscription platform that joins well, production, emissions and enforcement records [3]. Across 4,711 screened Colorado produced-gas analyses the median carbon dioxide content is 2.19 mole % [3]. Nearly 61% of those analyses carry 2% or more [3].
The spread runs wider than the median suggests [3]. The fifth percentile sits at 0.06% and the ninety-fifth at 3.04% [3]. A vented stream carries its own carbon dioxide alongside its methane.
That matters for two calculations at once. A venting estimate that counts only methane omits the carbon dioxide that left with it. A combustion estimate has to avoid counting the same carbon dioxide twice. The two paths need separating explicitly in the calculation.
The practical test is which stream the carbon dioxide left in. Carbon dioxide vented with the gas belongs to the vent estimate. Carbon dioxide leaving a stack belongs to the combustion estimate, whether it was formed there or arrived in the fuel.
Why Methane Dominates an Oil and Gas Inventory
Methane dominates for two reasons that compound, and the first is simply what the gas is made of. Methane is the largest component of natural gas by a wide margin, so almost anything escaping the pressurised system is mostly methane. The median Colorado produced-gas analysis runs 73.5% methane across 4,327 screened records [3].
The second reason is the conversion factor, which counts that mass at roughly thirty times its own weight. A vented stream that is three quarters methane therefore converts at more than an order of magnitude above what it weighs.
The consequence is that methane accuracy dominates inventory accuracy. A 10% error on methane outweighs the same error on combustion carbon dioxide.
That holds at most upstream sites. An intensity metric divides that CO2 equivalent total by production, so both the factor and the conversion carry into it. Colorado’s intensity programme is built on exactly that ratio, and is covered in Colorado Regulation 7: GHG Intensity Verification Factor.
What Carbon Dioxide Equivalent Actually Means
CO2 equivalent is a unit of account rather than a measurement. A mass of methane becomes a mass of CO2 equivalent by multiplying it by a global warming potential over a chosen time horizon [2]. Reporting programmes use the 100-year horizon [1]. That horizon is itself a choice.
Methane’s effect is concentrated early because it leaves the atmosphere quickly. A 100-year figure averages a strong early effect across a long tail. Reporting rules name the horizon so that submissions are comparable rather than because it is the only defensible one.
The factor is revised as the science is reassessed, and the revisions are not small [2]. Successive IPCC assessment reports have published different values for the same gas [2].
| 100-year GWP | AR4 | AR5 | AR6 |
|---|---|---|---|
| Methane, non-fossil | 25 | 28 | 27.0 |
| Methane, fossil | not published | 30 | 29.8 |
| Nitrous oxide | 298 | 265 | 273 |
AR4 and AR5 as tabulated by the Greenhouse Gas Protocol; AR6 from IPCC Working Group I, Table 7.15. [5]
Fossil and Non-Fossil Methane Are Different Rows
The fossil row is not a rounding variant of the non-fossil one [2]. It adds the radiative forcing of the carbon dioxide formed when that methane oxidises in the atmosphere [2]. Vented or leaked natural gas is fossil methane and takes the fossil row.
Methane in combustion exhaust takes the non-fossil row instead. Using the fossil row there would count the same carbon twice.
AR4 published no separate fossil value at all [2]. That absence is a fact about the report rather than a gap to fill with the non-fossil figure.
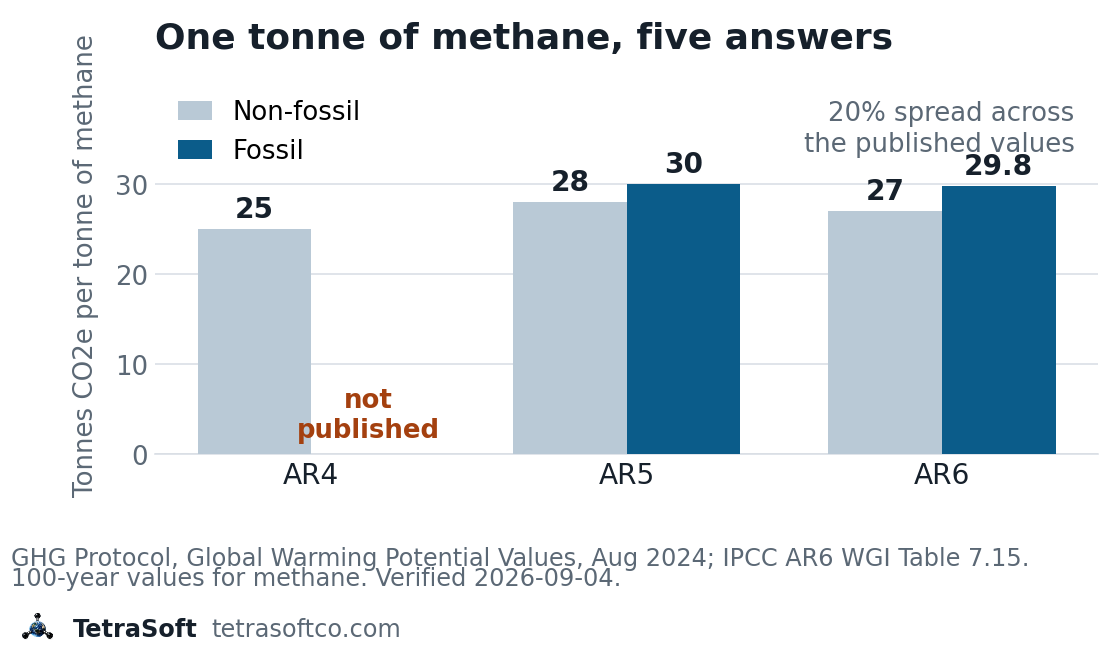
The same tonne of methane is worth 25 or 30 tonnes of CO2 equivalent depending on which cell applies. [2]
Which Basis a Reporting Programme Requires
The basis is chosen by the programme, not by the reporter. EPA amended the Greenhouse Gas Reporting Rule’s general provisions to reflect revised global warming potentials [1]. That rule published on 25 April 2024 and took effect on 1 January 2025 [1]. It moved Table A-1 to the AR5 100-year values, reaching for AR6 only where AR5 lists no value [1].
Methane rose from 25 to 28 and nitrous oxide fell from 298 to 265 [6]. The revision moved the two gases in opposite directions. The methane figure it adopted is the AR5 row without the fossil adjustment, so a GHGRP filing uses 28 rather than 30 [1].
Programmes move at different times, so two filings in the same year can use different factors. A total is only comparable against another total on the same basis.
What that obligation currently requires is covered in GHGRP Subpart W Reporting in 2026: What Is Still Required.
Where the Numbers Come From, and Where They Break
Almost none of a reported inventory is measured directly. Equipment counts are multiplied by emission factors, and the products are summed. The conversion to CO2 equivalent is then applied on top [1].
Two independent choices therefore sit between an operation and its reported number. Either can move the total without anything changing in the field.
An Inventory Is Mostly Arithmetic on Factors
A factor describes an average piece of equipment under normal operation. Applied to a count, it produces an expected mass rather than an observed one. The result is a plausible total that no instrument produced.
How independent observation compares against inventories built this way is covered in Why Satellites Show About 2x More Methane Than Inventories.
Where a Measurement-Informed Inventory Fits
The gap sits in the mass, not in the conversion. A global warming potential can be looked up and checked against the report that published it. The mass it multiplies cannot be looked up anywhere.
MAES is a mechanistic emissions model developed at CSU and UT Austin, which TetraSoft uses through a partnership with CSU [7]. It simulates a facility from its equipment and operating conditions [7]. It generates an expected emission range rather than a single value [7].
MAES does not choose a global warming potential and it does not file a report. Santos et al. (2025) combined that model with field measurement in the Denver-Julesburg Basin [8]. What the MAES platform addresses is the mass the conversion factor multiplies.
Frequently Asked Questions
Is carbon dioxide or methane the bigger problem in oil and gas?
For climate, methane, once the conversion is applied. Carbon dioxide is emitted in larger mass at most combustion sources. For local air quality and health the question has a different answer, because neither gas is the pollutant of concern. Benzene and the other hazardous air pollutants are governed by their own standard, and the volatile organic compounds in the same stream form ground-level ozone [4]. The reported CO2 equivalent total is nonetheless usually led by methane at upstream sites.
Why does the same emission produce different CO2e numbers?
Because the conversion factor is a published choice that has been revised [2]. Methane’s 100-year value is 25 under AR4 and 30 under the AR5 fossil row [2]. The same measured mass differs by a fifth between those two cells.
Which basis should an operator use?
Whichever the receiving programme names, and it is worth confirming rather than assuming. EPA’s reporting rule moved to the AR5 100-year values effective 1 January 2025 [1]. That put methane at 28 and nitrous oxide at 265 [6]. A voluntary or international framework may name a different assessment report.
What is the difference between fossil and non-fossil methane?
The fossil row adds the effect of the carbon dioxide formed when the methane oxidises [2]. Vented or leaked natural gas is fossil methane. Methane in combustion exhaust takes the non-fossil row to avoid counting that carbon twice.
Why is there no AR4 fossil value?
Because that assessment did not publish one [2]. The separate fossil row appears from AR5 onward [2]. Filling the gap with the non-fossil figure would present an invented number as a published one.
Does nitrous oxide matter in an upstream inventory?
It is small in mass and kept in the tables by its conversion factor. Its 100-year value is 298 under AR4 and 265 under AR5 [2]. It arises from combustion rather than from the produced stream.
Does venting release carbon dioxide as well as methane?
Yes, because the vented stream carries whatever the reservoir produced. Colorado produced-gas analyses carry a median 2.19 mole % carbon dioxide [3]. An estimate that counts only the methane understates what left the stack.
Can an operator change its reported total without changing operations?
Yes, and that is the uncomfortable part. A revised global warming potential changes the conversion [1]. A revised emission factor changes the mass, and neither requires anything to happen at the site. A year-on-year trend that spans a basis change is measuring both at once.
Interested in building a Measurement-Informed Inventory for your operations? Contact us to learn about our MAES-based estimation services.
Disclosure: Arthur Santos, the author of this post, is lead author of the Santos et al. (2025) study cited here and a co-author of the Mollel et al. (2025) study.
References
- 89 FR 31802, April 25, 2024. Revisions and Confidentiality Determinations for Data Elements Under the Greenhouse Gas Reporting Rule; effective 1 January 2025. https://www.federalregister.gov/documents/2024/04/25/2024-06120/revisions-and-confidentiality-determinations-for-data-elements-under-the-greenhouse-gas-reporting
- Greenhouse Gas Protocol, Global Warming Potential Values, August 2024. https://ghgprotocol.org/sites/default/files/2024-08/Global-Warming-Potential-Values%20%28August%202024%29.pdf
- TetraSoft Atlas, multi-state wellhead gas composition dataset. Gas chromatography analyses across eight states, sourced from state agency filings and the USGS Natural Gas Compositional Analyses Dataset, verified 2026-09-04. https://tetrasoftco.com/atlas-landing.html#pricing
- 40 CFR Part 63, Subpart HH, National Emission Standards for Hazardous Air Pollutants From Oil and Natural Gas Production Facilities; Subpart HHH, Natural Gas Transmission and Storage Facilities. https://www.ecfr.gov/current/title-40/chapter-I/subchapter-C/part-63/subpart-HH
- IPCC AR6 Working Group I, Table 7.15. Intergovernmental Panel on Climate Change, Sixth Assessment Report, Working Group I. https://www.ipcc.ch/report/ar6/wg1/
- 40 CFR Part 98, Subpart A, Table A-1, Global Warming Potentials, as amended at 89 FR 31894, April 25, 2024. https://www.ecfr.gov/current/title-40/chapter-I/subchapter-C/part-98/subpart-A/appendix-Table%20A-1%20to%20Subpart%20A%20of%20Part%2098
- Mollel et al., 2025, ACS ES&T Air, 2, 723-735, DOI 10.1021/acsestair.4c00168. “Using Prototypical Oil and Gas Sites to Model Methane Emissions in Colorado’s Denver-Julesburg Basin Using a Mechanistic Emission Estimation Tool.” https://doi.org/10.1021/acsestair.4c00168
- Santos et al., 2025, ACS ES&T Air, 2, 1598-1611, DOI 10.1021/acsestair.5c00089. “Using Measurement-Informed Inventory to Assess Emissions in the Denver-Julesburg Basin.” https://doi.org/10.1021/acsestair.5c00089
This post is for informational purposes only and does not constitute legal or compliance advice. Consult qualified legal counsel or a compliance professional for guidance specific to your operations and jurisdiction.
Interactive tool
What the CO2e basis does to your number
The same measured mass converts differently under each published basis. This holds the mass fixed and shows every answer at once.
Spread across the published bases
0.7%
- Lowest
- 2,980 t CO2e
- Highest
- 3,000 t CO2e
By basis
| Basis | CH4 GWP | N2O GWP | Total t CO2e |
|---|---|---|---|
| AR4 | not published | 298 | -- |
| AR5 | 30 | 265 | 3,000 |
| AR6 | 29.8 | 273 | 2,980 |
AR4 published no separate fossil methane value. That row reads "not published" rather than repeating the non-fossil figure, because the absence is a fact about the report.
AR4 and AR5 values as tabulated in Greenhouse Gas Protocol, Global Warming Potential Values, August 2024; AR6 from IPCC AR6 Working Group I, Table 7.15. All are 100-year values. Which basis applies to a filing is set by the receiving programme, not by this tool. Nothing leaves your browser.
Comments
0Share your thoughts. All comments are moderated before appearing.
No comments yet. Be the first to share your thoughts!