Methane is a potent, short-lived greenhouse gas with an atmospheric lifetime of 9 to 11 years, so cutting it can substantially slow near-term warming [1]. Oil and gas is the second largest methane-emitting sector in the United States [1]. Over 150 countries and 50 oil and gas companies have pledged to cut their methane emissions substantially this decade [1].
Progress on such pledges is tracked against inventories, and most inventories are estimates rather than measurements. The US Greenhouse Gas Inventory, or GHGI, is EPA’s national estimate, built from activity data and emission factors [2]. An emission factor is an average emission rate per piece of equipment or per unit of activity. MethaneAIR is an airborne imaging spectrometer, an instrument that measures methane concentrations across a wide area at fine resolution [3].
A 2026 study by MacKay and colleagues flew MethaneAIR over 12 major US oil and gas basins and compared the result with EPA.
This post explains what that study found. It covers what MethaneAIR measured and how, then how far above EPA each basin ran. Within that comparison it shows which basins emit the most and what may explain EPA placing too little methane there. It ends with what factor-based inventories miss, for operators and analysts who report or check inventories.
Quick Answer: June-October 2023 flights put oil and gas methane in measured areas of twelve US basins at about 7.9 million metric tons a year [1]. EPA’s 2020 inventory assigns those same areas about 1.6 million metric tons a year, so within them the measured figure is about five times higher [1]. Every basin’s central estimate exceeded EPA’s oil and gas figure, 1.3 to 7.9 times, though Barnett’s and Bakken’s uncertainty ranges reach below it [1]. The combined loss rate was 1.6% of gas produced, against EPA’s 0.4% for the same regions [1].
What MethaneAIR Measured: 7.9 Million Tonnes of Oil and Gas Methane a Year
The headline is an annual total scaled up from daytime flights, assuming constant emissions, so its scope needs pinning down before comparing it with EPA. The study estimated 8.9 million metric tons of methane a year from all sources across the measured regions, with a range of 7.8 to 10 [1]. About 90%, an estimated 7.9 million metric tons, was attributed to oil and gas after subtracting literature estimates of other sources [1]. Scientists write a million metric tons as a teragram, so the paper reports these as 8.9 and 7.9 Tg/yr.
The measurements come from 32 flights flown between June and October 2023 [1]. The authors turned the flight results into annual totals by assuming emissions stay constant through the year [1]. The flights covered twelve basins: the Permian, Appalachian, Haynesville-Bossier, Eagle Ford, Anadarko, Denver-Julesburg, Bakken, Barnett, Arkoma-Fayetteville, Greater Green River, Piceance, and Uinta [1]. A basin is a large depression filled with sedimentary rock, where oil and gas accumulate; the paper calls all twelve major producing basins.
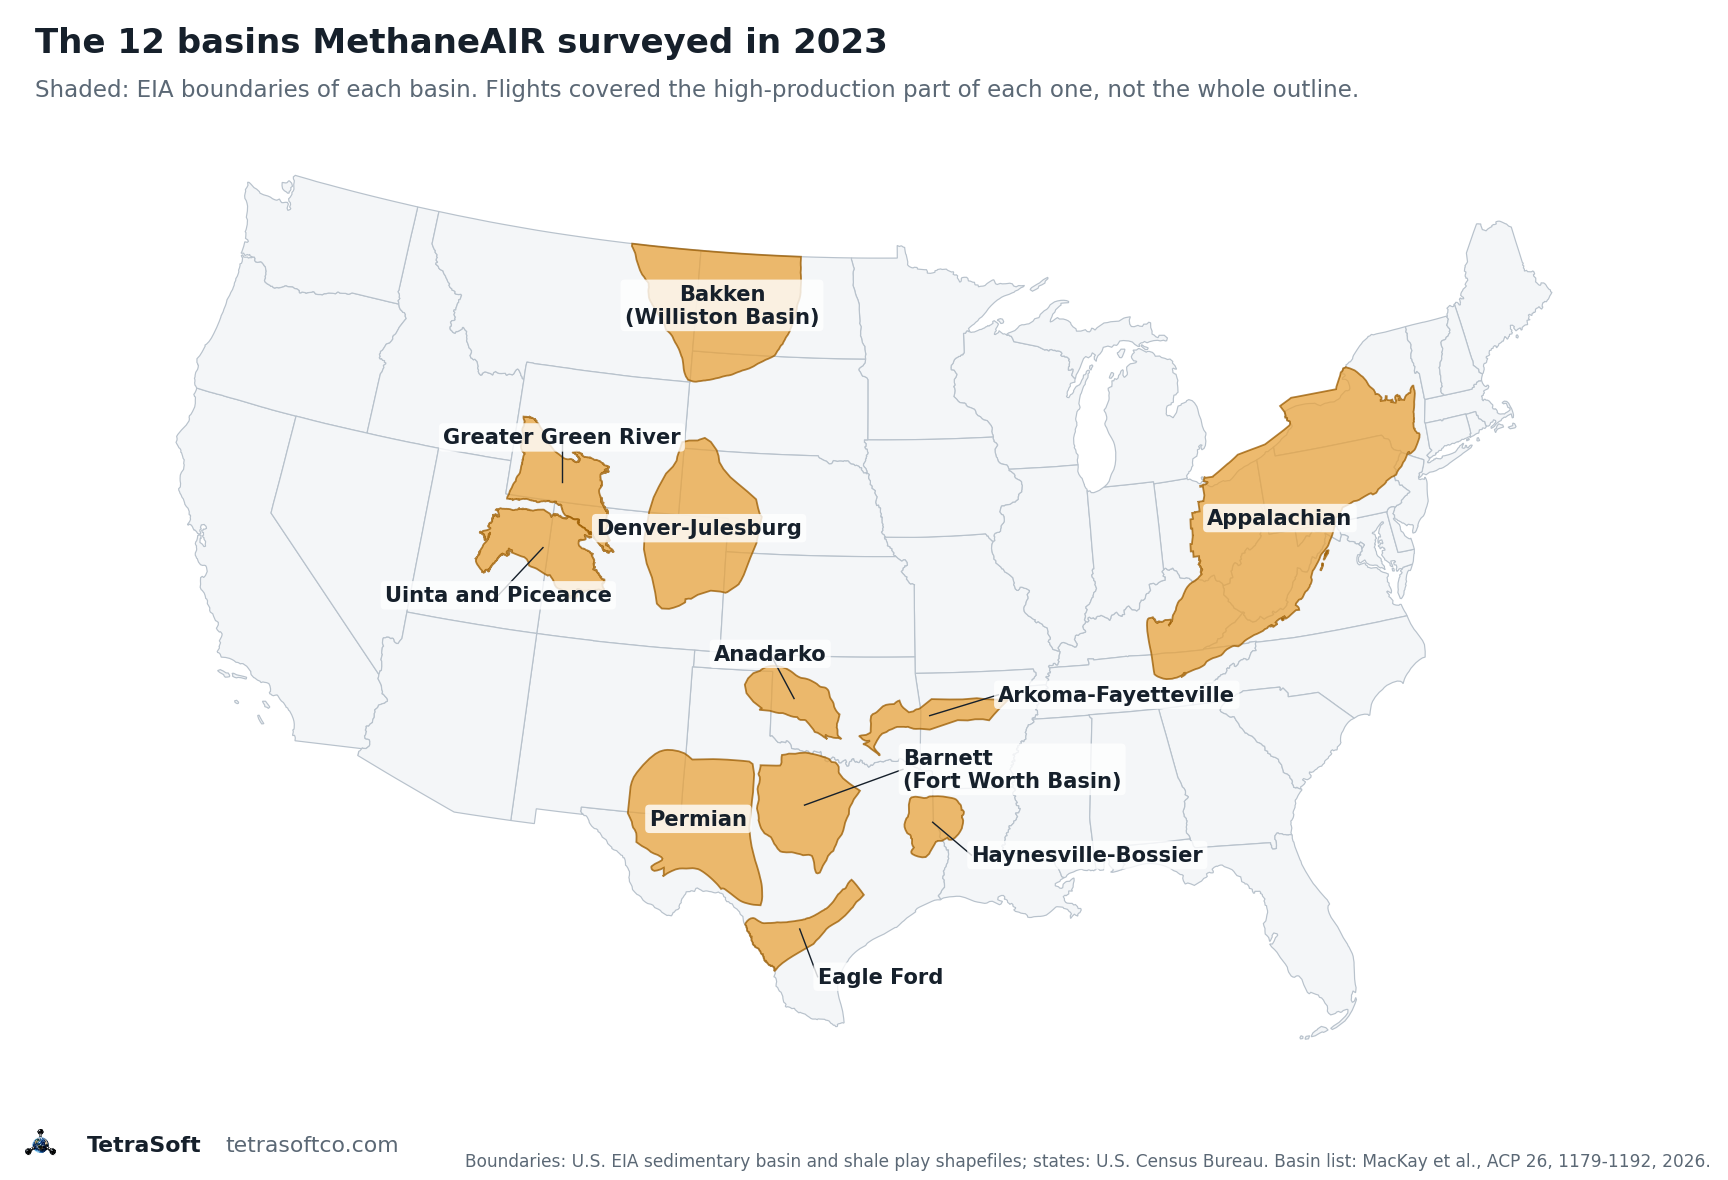
The twelve basins in MacKay et al. (2026). Outlines are U.S. Energy Information Administration (EIA) sedimentary basin boundaries; Eagle Ford and Haynesville-Bossier use EIA shale play boundaries, and EIA draws the Uinta and Piceance as one basin. State lines: U.S. Census Bureau. MethaneAIR flew over the high-production part of each basin, not the whole outline.
The contiguous United States (CONUS) is the 48 adjoining states, leaving out Alaska and Hawaii. Together the measured areas produced 70% of CONUS onshore oil and gas in 2023 [1]. Within each basin the flights covered at least two-thirds of its production, except in the Bakken and Greater Green River [1].
EPA’s comparison number is the GHGI for 2020, mapped onto a grid and summed over exactly the areas MethaneAIR flew [1]. For those areas EPA estimates 1.6 million metric tons of oil and gas methane a year, about 21% of its onshore CONUS total [1]. The measured 7.9 against EPA’s 1.6 is the source of the five-times headline.
How MethaneAIR Sees Methane from 12 Kilometres Up
The instrument’s resolution sets what the totals can and cannot tell an operator, so it is worth stating exactly. In the 2023 campaign MethaneAIR flew on a modified Lear 35 jet at about 12 km altitude [1]. Each flight covered about 10,000 square kilometres in roughly two hours [1].
In its 2021 test flights at 12,960 m above ground, MethaneAIR recorded a swath about 4.5 km wide [3]. Its pixel centres sit 5 m apart across the flight track and about 25 m apart along it [3]. The processed data are gridded to 10 m by 10 m pixels [3].
The study then works at two coarser scales. Single sources emitting more than about 200 kg of methane an hour are located and quantified individually [1]. Everything smaller is estimated as dispersed emissions on a 1 km by 1 km grid [1]. Each flight is a daytime snapshot of about two hours, which may miss emissions that vary over a day or longer [1].
MethaneAIR was built as the airborne precursor of MethaneSAT, a satellite with similar spectroscopy launched on 4 March 2024 [1].
MethaneSAT is the one no longer operating. Mission operations lost contact with it on June 20, 2025 [4]. EDF said on July 1 that the satellite had lost power and was likely not recoverable [4]. The November 2025 investigation traced the failure to the flight avionics or the electrical power subsystem, but the specific cause remains unknown [5].
How Far Above EPA Each Basin Ran
With the scope settled, the next question is whether the gap is spread evenly or driven by a few basins. Measured methane exceeded EPA’s estimate in every basin flown [1]. Total methane ran from 1.8 times EPA in the Barnett to 8.2 times in the Greater Green River [1]. Oil and gas methane alone ran from 1.3 times to 7.9 times higher [1].
| Basin | MethaneAIR total methane (kg/h) | EPA total methane (kg/h) | Times higher | MethaneAIR oil and gas methane (kg/h) | EPA oil and gas methane (kg/h) | Times higher |
|---|---|---|---|---|---|---|
| Greater Green River | 44,600 | 5,430 | 8.2 | 41,800 | 5,270 | 7.9 |
| Permian | 318,000 | 52,000 | 6.1 | 314,000 | 49,030 | 6.4 |
| Piceance | 65,000 | 12,300 | 5.3 | 63,500 | 10,690 | 5.9 |
| Uinta | 35,900 | 7,970 | 4.5 | 34,900 | 7,290 | 4.8 |
| Appalachian | 209,800 | 49,280 | 4.3 | 160,000 | 21,630 | 7.4 |
| Eagle Ford | 65,200 | 17,280 | 3.8 | 59,600 | 14,250 | 4.2 |
| Haynesville-Bossier | 111,000 | 31,700 | 3.5 | 95,400 | 24,760 | 3.9 |
| Arkoma-Fayetteville | 23,800 | 7,380 | 3.2 | 21,300 | 5,860 | 3.6 |
| Anadarko | 56,300 | 18,200 | 3.1 | 49,500 | 13,880 | 3.6 |
| Bakken | 12,900 | 5,640 | 2.3 | 12,300 | 5,210 | 2.4 |
| Denver-Julesburg | 37,300 | 18,200 | 2.0 | 24,200 | 8,010 | 3.0 |
| Barnett | 38,300 | 21,700 | 1.8 | 21,900 | 16,380 | 1.3 |
| 12 basins | 1,018,000 | 247,080 | 4.1 | 898,000 | 182,260 | 4.9 |
Methane in kilograms per hour over the areas MethaneAIR flew in each basin. MethaneAIR: flights June to October 2023 (MacKay et al. 2026, Table 3). EPA: Greenhouse Gas Inventory for 2020 over the same areas (MacKay et al. 2026, supplement Table S4). “Times higher” is the MethaneAIR figure divided by the EPA figure; the EPA 12-basin sums add the supplement’s rows.
The EPA figures in the table cover the same measured areas, taken from the study’s supplement [6]. The ratio columns divide one source’s number by the other’s, which reproduces the paper’s stated range of 1.8 to 8.2 for total methane. Across all twelve basins, measured total methane is about four times EPA’s figure [1]. The Appalachian shows why both columns matter, because it also has significant methane from the coal and waste sectors [1].
The EPA figures are for 2020 and the flights were in 2023, so some of the gap could be real change [1]. The authors judge, without quantifying it, that changes in activity over those three years are unlikely to explain discrepancies this large [1].
Which Basins Emit the Most, and Which Lose the Largest Share of Their Gas
The ratios say how wrong the inventory is, but they do not say where the most methane comes from. The study answers that with two measures [1]. One is the absolute amount of oil and gas methane. The other is the loss rate, the methane emitted as a share of the gross gas the basin produced [1].
| Basin | MethaneAIR oil and gas methane (kg/h, uncertainty) | Loss rate (% of gross gas production) | 2023 gas production (million barrels of oil equivalent) | Share of basin production flown | Flights |
|---|---|---|---|---|---|
| Permian | 314,000 (±34%) | 2.4% | 1,410 | 88% | 8 |
| Appalachian | 160,000 (±47%) | 0.9% | 2,167 | 68% | 3 |
| Haynesville-Bossier | 95,400 (±28%) | 0.9% | 983 | 95% | 3 |
| Piceance | 63,500 (±44%) | 7.9% | 73 | 93% | 2 |
| Eagle Ford | 59,600 (±36%) | 2.0% | 487 | 73% | 2 |
| Anadarko | 49,500 (±46%) | 1.4% | 342 | 78% | 2 |
| Greater Green River | 41,800 (±27%) | 5.2% | 147 | 44% | 2 |
| Uinta | 34,900 (±50%) | 7.7% | 46 | 92% | 2 |
| Denver-Julesburg | 24,200 (±40%) | 1.3% | 183 | 91% | 5 |
| Barnett | 21,900 (±60%) | 1.6% | 144 | 80% | 1 |
| Arkoma-Fayetteville | 21,300 (±57%) | 3.1% | 63 | 88% | 1 |
| Bakken | 12,300 (±78%) | 2.1% | 200 | 48% | 1 |
| 12 basins | 898,000 (±16%) | 1.6% | 32 |
MethaneAIR estimates for the measured areas, flights June to October 2023 (MacKay et al. 2026, Table 3). Gas production for 2023 is from Enverus as reported in the paper’s Table 1. Basins with one flight carry the widest uncertainty.
The Permian, Appalachian and Haynesville-Bossier had the highest oil and gas methane emissions, and they are also the most productive of the study’s basins [1]. Gas-dominant basins with productive wells, the Appalachian and Haynesville-Bossier, have the lowest loss rates, below 1% [1]. Oil-dominant or mixed basins such as the Permian, Eagle Ford and Bakken tend to sit between 2% and 5%, the paper says [1]. There are exceptions: the mixed Denver-Julesburg is at 1.3%, and the gas-dominant Arkoma-Fayetteville at 3.1% [1].
The mature Piceance and Uinta, dominated by large numbers of ageing, low-producing wells, have the highest loss rates, at 7.9% and 7.7% [1]. The authors attribute that, likely, to fugitive methane that keeps escaping even as production declines [1]. A basin can therefore rank low on total emissions and high on loss rate, which is why the paper argues for judging basins on both [1].
Why EPA Places Too Little Methane in These Basins
The size of the gap may also reflect where EPA puts the methane it does count, not only how much it counts. EPA assigns only 21% of its onshore CONUS oil and gas methane, 1.6 million tonnes a year, to the measured areas [1]. The measured areas produced more than 70% of onshore CONUS oil and gas in 2023 [1]. The mismatch is large.
EPA places the other 79%, 6.1 million tonnes a year, in regions holding only 30% of production [1].
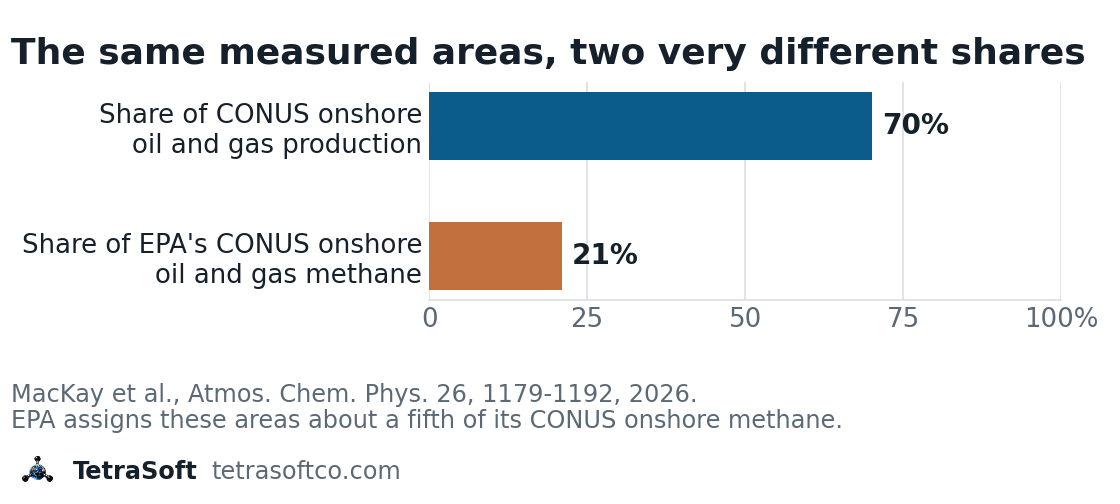
The twelve study basins hold over 70% of onshore oil and gas production in the contiguous US and about 21% of EPA’s onshore oil and gas methane there. MacKay et al., Atmospheric Chemistry and Physics, 26, 1179-1192, 2026.
The authors suggest the discrepancy is partly due to EPA emission factors that may be unrepresentative across basins [1]. Part of the five-times multiplier may therefore reflect where EPA places its national total, not only how much methane that total carries. EPA’s whole onshore CONUS oil and gas estimate, about 7.7 million tonnes a year, nearly equals the 7.9 million estimated for the measured areas alone. The same pattern shows up from orbit, as set out in Why Satellites Show About 2x More Methane Than Inventories.
What Factor-Based Inventories Miss, and What Operators Can Do
If unrepresentative factors are part of the cause, the useful question for an operator is what a factor leaves out. Oil and gas facilities emitting 25,000 metric tons CO2e or more a year report to EPA under Subpart W of the Greenhouse Gas Reporting Program [7]. States can add their own layer: Colorado requires oil and gas operators to submit annual emissions inventory reports [8]. The program’s rules are 40 CFR Part 98, part of the Code of Federal Regulations, and they prescribe the calculation methods [7].
Some of those methods, such as the one for natural gas pneumatic devices, multiply equipment counts by default emission factors. GHGRP Subpart W Reporting in 2026: What Is Still Required sets out what is reported today.
EPA proposed in September 2025 to suspend the remaining Subpart W segments until reporting year 2034, and that proposal is not final [9]. MacKay and colleagues compare their totals with EPA’s national inventory, not with individual Subpart W facility reports [1].
A factor is a population average, so it does not record when or where a particular malfunction happens. Consider a wellpad with a stuck dump valve venting 5 kg of methane an hour for three weeks. That single event releases about 2.5 metric tons of methane, which an average emission factor does not capture.
Subpart W counts such an event through a separate stuck-dump-valve calculation, which depends on detecting the open valve [7]. At about 2.5 tonnes each, matching the twelve-basin gap of roughly 6 million tonnes a year would take some 2.5 million such events. The example shows the mechanism a factor misses, not the size of the gap.
Basin totals from the air answer how much methane a region emits, not which equipment emitted it. A Measurement-Informed Inventory, or MII, aims at that question by combining a mechanistic model of each facility with site measurements [10]. MAES, the Mechanistic Air Emissions Simulator developed at Colorado State University and UT Austin, models individual equipment failures and operational shifts at each facility [11]. It turns second-by-second emission estimates into a probability distribution, giving an expected emission range for each simulated site rather than one value [10].
Interested in building a Measurement-Informed Inventory for your operations? Contact us to learn about our MAES-based estimation services.
This post is for informational purposes only and does not constitute legal or compliance advice. Consult qualified legal counsel or a compliance professional for guidance specific to your operations and jurisdiction.
Frequently Asked Questions
What is MethaneAIR and how does it differ from satellite methane detection?
MethaneAIR is a methane-sensing imaging spectrometer flown on a jet at about 12 km [1]. Its data are gridded to 10 m by 10 m pixels [3]. TROPOMI, the TROPOspheric Monitoring Instrument satellite, maps the whole globe daily but at 5 km by 7 km [3]. A flight covers one region for about two hours, so it is a snapshot rather than daily coverage [1].
What happened to MethaneSAT?
MethaneSAT lost contact on June 20, 2025, and EDF said on July 1 that it had lost power and was likely not recoverable [4]. Operators made nearly 400 attempts to re-establish communication over 21 days without success [5]. The investigation traced the failure to the flight avionics or the electrical power subsystem, but the specific cause remains unknown [5].
Is EPA underestimating methane emissions from oil and gas?
Measurement studies keep finding more oil and gas methane than EPA’s inventory reports [1]. MacKay et al. found about five times EPA’s 2020 estimate across twelve basins [1]. They cite Alvarez et al. 2018, Omara et al. 2024, Sherwin et al. 2024 and Zhang et al. 2020 as finding similar differences [1]. Such findings date back over a decade, to Brandt et al. 2014 [1].
What is a methane loss rate, and what counts as low?
A loss rate is the methane emitted divided by the methane in the gross gas produced, expressed as a percentage [1]. MethaneAIR’s 1.6% across twelve basins is more than four times EPA’s 0.4% for the same areas [1]. It is also more than eight times the intensity target in the Oil and Gas Decarbonization Charter, an industry pledge [1].
Get regulatory updates and emissions data insights in your inbox. Subscribe to the TetraSoft newsletter.
References
- MacKay, K., Benmergui, J., Williams, J. P., Omara, M., Himmelberger, A., Sargent, M., Warren, J. D., Miller, C. C., Roche, S., Zhang, Z., Franklin, J., Guanter, L., Wofsy, S., and Gautam, R. “Assessment of methane emissions from US onshore oil and gas production using MethaneAIR measurements.” Atmospheric Chemistry and Physics, 26, 1179–1192, 2026. URL: https://acp.copernicus.org/articles/26/1179/2026/
- EPA. “Inventory of U.S. Greenhouse Gas Emissions and Sinks: 1990–2023.” 2025. URL: https://www.epa.gov/ghgemissions/inventory-us-greenhouse-gas-emissions-and-sinks
- Chulakadabba, A., Sargent, M., Lauvaux, T., Benmergui, J., Franklin, J. E., Chan Miller, C., Wilzewski, J. S., Roche, S., Conway, E., Souri, A. H., Sun, K., Luo, B., Hawthrone, J., Samra, J., Daube, B. C., Liu, X., Chance, K., Li, Y., Gautam, R., Omara, M., Rutherford, J. S., Sherwin, E. D., Brandt, A., and Wofsy, S. C. “Methane point source quantification using MethaneAIR: a new airborne imaging spectrometer.” Atmospheric Measurement Techniques, 16, 5771–5785, 2023. DOI: 10.5194/amt-16-5771-2023
- Environmental Defense Fund. “MethaneSAT Loses Contact with Satellite.” Press release, July 1, 2025. URL: https://www.edf.org/media/methanesat-loses-contact-satellite
- MethaneSAT. “Results of the Anomaly Investigation into the Loss of Communication with MethaneSAT.” Project update, November 6, 2025. URL: https://www.methanesat.org/project-updates/results-anomaly-investigation-loss-communication-methanesat
- MacKay, K., et al. Supplement to “Assessment of methane emissions from US onshore oil and gas production using MethaneAIR measurements.” Atmospheric Chemistry and Physics, 26, 1179–1192, 2026, Table S4. URL: https://acp.copernicus.org/articles/26/1179/2026/acp-26-1179-2026-supplement.pdf
- EPA. Greenhouse Gas Reporting Program, Subpart W: Petroleum and Natural Gas Systems. 40 CFR Part 98, Subpart W. https://www.ecfr.gov/current/title-40/chapter-I/subchapter-C/part-98/subpart-W
- Colorado Department of Public Health and Environment. “Oil and Natural Gas Annual Emission Inventory Reporting (ONGAEIR).” Web page. URL: https://cdphe.colorado.gov/ongaeir
- US EPA, Reconsideration of the Greenhouse Gas Reporting Program, proposed rule, 90 FR 44591, September 16, 2025. https://www.govinfo.gov/content/pkg/FR-2025-09-16/html/2025-17923.htm
- Colorado State University METEC. “Measurement-Informed Inventory.” Web page. URL: https://metec.colostate.edu/measurement-informed-inventory/
- Santos, A., Mollel, W., Duggan, G. P., Hodshire, A., Vora, P., Zimmerle, D. “Using Measurement-Informed Inventory to Assess Emissions in the Denver-Julesburg Basin.” ACS ES&T Air, 2, 1598–1611, 2025. DOI: 10.1021/acsestair.5c00089
Comments
0Share your thoughts. All comments are moderated before appearing.
No comments yet. Be the first to share your thoughts!