A storage tank emissions calculation has to account for three separate mechanisms, and only two of them are evaporative [1]. Standing loss is vapor pushed out as the tank breathes with daily temperature and pressure swings [1]. Working loss is vapor displaced when liquid is pumped in [1]. Flashing is different, because it is entrained gas coming out of solution when pressurized liquid drops to tank pressure [1]. For a production tank battery taking liquid from a separator, flashing is the mechanism the standard reference declines to give you an equation for [1].
Closing that gap is what a mechanistic simulation is for. TetraSoft’s MAES Platform runs that calculation while simulating the whole battery.
The three are not equal contributors, which matters before deciding where to spend effort. OGMP 2.0’s guidance on unstabilized liquid storage tanks ranks them directly [2]. It identifies flash losses as the most significant of the three for tanks fed from a higher-pressure separator [2]. Working losses come next, driven by throughput and agitation as liquid enters, and standing losses last, driven by daily and seasonal temperature and pressure swings [2]. No single split applies everywhere, and the guidance explains why rather than publishing one [2]. The flashed volume scales with the pressure differential between the separator and the tank [2]. The guidance illustrates the case with a single separator at 35 to 50 psig discharging to a stock tank [2]. Real batteries are rarely that tidy, because a tank can receive liquid from more than one separation stage, each at its own pressure. The same tank behind a higher-pressure separator is a different emissions problem. Lighter crude flashes more than heavy, with API gravity above 36 degrees named as the dividing line [2]. High-throughput tanks with frequent cycling shift the balance toward working losses [2]. An operator wanting the split for their own battery has to derive it from their own separator pressure, liquid composition, and throughput.
The practical consequence is uncomfortable. The two mechanisms AP-42 gives you closed-form equations for are the two smaller ones, and the one it declines to quantify is generally the largest [2]. Refining a standing loss calculation therefore moves the total least.
Quick Answer: Total routine tank loss is standing loss plus working loss, and EPA AP-42 Chapter 7.1 gives an equation for each [1]. Flashing loss is a third mechanism, applying to tanks that receive pressurized liquid from a separator [1]. AP-42 states that guidance for estimating it is beyond the scope of that section [1]. All three assume the tank and its upstream equipment are working as designed.
The Three Loss Mechanisms a Tank Calculation Has to Cover
Total routine loss from a fixed roof tank is the sum of just two terms [1]. AP-42 Equation 1-1 states it as total losses equal standing losses plus working losses, both in pounds per year [1]. Everything difficult about an upstream tank sits outside that sum.
| AP-42 equation | Formula |
|---|---|
| Eq. 1-1, total routine loss | LT = LS + LW |
| Eq. 1-2, standing loss | LS = 365 × VV × WV × KE × KS |
| Eq. 1-37, working loss | LW = VQ × KN × KP × WV × KB |
| Symbol | Meaning | Units |
|---|---|---|
| LT | Total routine losses | lb/yr |
| LS | Standing loss (vapour breathed out as the tank warms and cools) | lb/yr |
| LW | Working loss (vapour displaced as liquid is pumped in) | lb/yr |
| VV | Tank vapour space volume | ft³ |
| WV | Stock vapour density | lb/ft³ |
| KE | Vapour space expansion factor | per day |
| KS | Vented vapour saturation factor | dimensionless |
| VQ | Net working loss throughput | ft³/yr |
| KN | Working loss turnover (saturation) factor | dimensionless |
| KP | Working loss product factor (0.75 for crude oils, 1 otherwise) | dimensionless |
| KB | Vent setting correction factor (1 for open vents and settings within ±0.03 psig) | dimensionless |
Neither equation contains a flashing term, which is the whole difficulty with an upstream tank. The word routine in that equation is AP-42’s own label for standing plus working losses [1]. AP-42 restricts that usage to itself, noting it does not carry over to permitting purposes such as New Source Review [1].
Flashing is left out of the sum for want of an equation, not because it is abnormal [1]. AP-42 describes it as occurring in addition to routine standing and working losses [1].
Standing loss, Equation 1-2, is built from the tank vapor space volume and the stock vapor density [1]. It also carries a vapor space expansion factor and a vented vapor saturation factor, multiplied by 365 days [1]. Working loss, Equation 1-37, is built from net throughput and a turnover saturation factor, together with a product factor and a vent setting correction [1]. Both are tractable from tank dimensions, liquid properties, and site weather.
The two covered mechanisms also act in a different place from the uncovered one. Standing and working losses happen at the tank, and flashing happens at the pressure drop upstream of it [1]. That is why refining a tank-side input cannot recover the missing term.
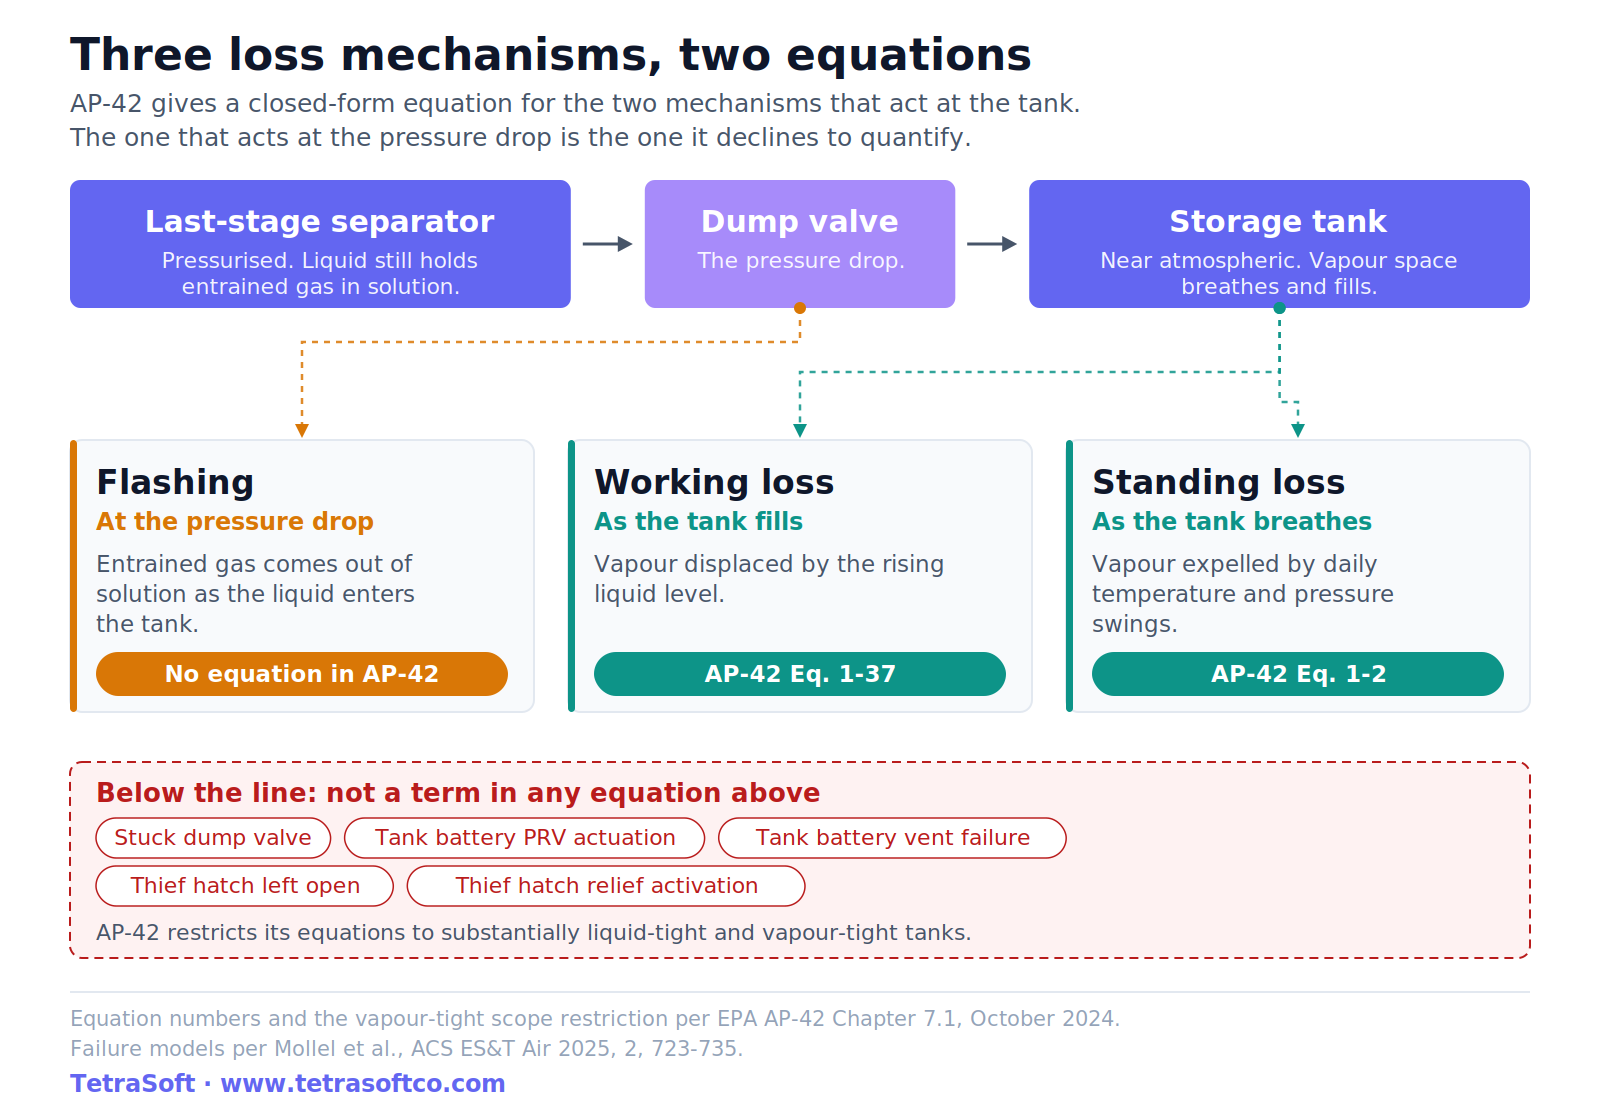
Flashing Is the Term AP-42 Leaves to You
AP-42 describes flashing as gases rapidly migrating out of a liquid [1]. The comparison it draws is carbon dioxide fizzing out of a carbonated beverage when the container is opened [1]. It names crude oil and condensate storage in the production field as the most common case [1]. Condensate is the lighter of the two, closer to the gas it separated from, and crude the heavier. The exit pressure from the last stage separator can be well above the pressure in the first storage tank, so remaining gases flash on entry [1].
Then AP-42 stops. It states that numerous methodologies exist but that discussion of them is beyond the scope of the section [1]. It does name the two families: methods relying on a site-specific sample, and methods relying on process simulation [1]. It also specifies where to characterize the fluid, which is the last stage separator, in the oil compartment before the dump valve [1].
That second family, process simulation, is where a mechanistic simulator earns its place [1]. Flashing is a thermodynamic problem rather than an empirical one. Given the liquid composition and the two pressures, the flashed volume and composition follow from an equilibrium calculation. That is precisely the calculation AP-42 points at and then leaves to the reader [1].
The Mechanistic Air Emissions Simulator (MAES) performs it as part of simulating the battery [3]. It models the separator, the dump valve, and the tank as connected equipment rather than as a lookup [3]. The flash calculation and the failure models therefore run against the same fluid and operating conditions [3]. An operator gets the flashed volume without commissioning a separate sample-and-simulate exercise for it, and gets it under failure states as well as design states.
TetraSoft’s MAES Platform is where that calculation is actually run [4]. A battery is assembled in MAES Studio as connected equipment [4]. The separation stages, the tanks, and the controls are wired in the order the fluid moves through them [4]. The Monte Carlo simulation then runs in the cloud [4]. The tank sits downstream of the separator in the same model [4]. The flash calculation therefore inherits the separator pressure and the last-stage liquid composition, rather than asking the user for a flash factor.
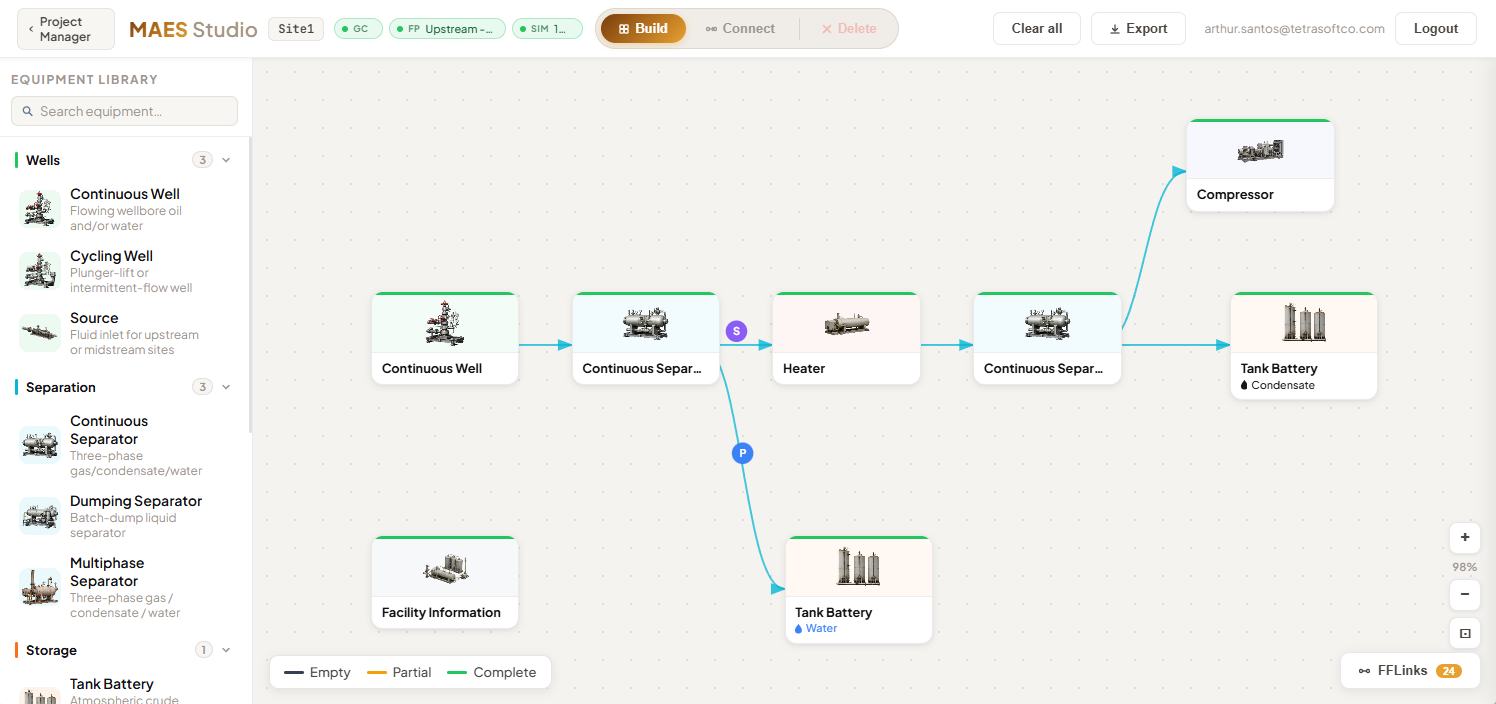
Physics-based models cover the flash at the tank inlet and the failure states around it [4]. The same library covers the separators, heaters, compressors, flares, dehydrators, and vapour recovery units that make up the rest of the site [4]. The failure modes are the ones no AP-42 equation contains: stuck dump valves, pressure relief valve actuations, and thief hatch failures [4].
The result is a P5, mean, and P95 distribution rather than a single number, with failure-mode emissions reported separately from normal-operation emissions [4]. That split tells an operator which half of the total is in play. Flash is a design and control question, while a failure is a maintenance one somebody can go and fix.
What the Permitting Agencies Accept Instead
AP-42 declines to name a method, and the state permitting agencies filled the gap themselves. The Air Permits Division of the Texas Commission on Environmental Quality lists four [5]. Only one of them returns flash alone; the other three produce working and breathing losses in the same run [5].
| Method TCEQ accepts | What it returns | What it needs |
|---|---|---|
| Direct measurement of tank emissions | Working, breathing, and flash | All vapours routed to one point, with flow, temperature, and extended gas chromatography |
| Process simulator software | Working, breathing, and flash | A site-specific sample, plus the equipment arrangement and operating parameters |
| E&P Tanks V3.0, sampling option | Working, breathing, and flash | A pressurized liquid or gas sample from the separator |
| Laboratory GOR from a pressurized sample | Flash only | A pressurized liquid sample flashed to tank conditions in a laboratory |
That is permitting guidance rather than rule text, and TCEQ describes its own accuracy ranking as a preliminary opinion [5]. Process simulation is the one family that appears on all three of the state lists surveyed here. It is also the family AP-42 itself points to [1].
The list is shorter than it used to be [5]. The September 2025 revision removed four methods from the accepted set [5]. They are the Vasquez-Beggs equation, the EC/R equation, the E&P Tanks V2.0 geographical database option, and the Griswold and Ambler GOR chart method [5]. The stated grounds are that these are older methods no longer supported [5].
That removal matters because Vasquez-Beggs is the method an operator is most likely to meet first. The Kansas fact sheet names it the default method required for all facilities with flash emissions [6]. Louisiana accepts it as an alternate method, approved case by case [7]. The Kansas sheet carries no revision date [6]. The Louisiana page is undated [7].
The Kansas sheet is candid about the equation it requires. It records that tank-flashing estimates made with Vasquez-Beggs may be considerably underestimated or overestimated [6]. It attributes that spread to the many variables affecting flash losses [6]. It adds that the variability is most apparent near the wellhead, where the pressure drop is highest and the liquid composition most variable [6]. It also notes that the equation returns total VOC only, without speciation, and calculates no standing or working losses at all [6].
None of that settles which list is right. It does mean the applicable list has to be established before a method is chosen. The same calculation, performed the same way, is required in one jurisdiction and struck from the accepted set in another.
Where the Standard Approach Breaks
Every one of those equations describes a tank behaving as designed. AP-42 says so in its own scope note, restricting the equations to tanks that are substantially liquid-tight and vapor-tight [1]. A tank with a hatch propped open or a relief valve stuck is neither.
Recall that AP-42 sends you to sample just upstream of the dump valve [1]. The standard method therefore characterizes the fluid at exactly the point whose failure it does not model.
That dump valve is the single most consequential thing that fails on a tank battery. It is the failure the published DJ Basin study selected to demonstrate mechanistic modeling [3].
Five Failure Models Cover the Tank Battery
Mechanistic modeling of a tank battery is organized around a short, specific list [3]. The published implementation names five [3].
| Failure model | What happens |
|---|---|
| Stuck dump valve | Valve does not fully close, so a fraction of separator gas passes downstream to equipment not rated for it |
| Tank battery PRV actuation | Gas entering plus gas flashed exceeds a threshold, so the relief valve opens and vents until flow drops |
| Tank battery vent failure | The relief valve sticks open on minimal stimulus, leaving the tank open to atmosphere until someone repairs it |
| Tank thief hatch left open | A hatch opened for gauging is not closed afterward, leaving the tank open to atmosphere |
| Thief hatch pressure relief activation | The hatch’s backup relief actuates when the tank PRV does not, and on some designs stays open |
The stuck dump valve is the one that starts the chain [3]. The factors these calculations lean on, and what they assume, are covered in AP-42 Emission Factors by Source Type, and What They Assume. It creates no emissions by itself, but it pushes high-pressure gas into atmospheric tanks that cannot take it, which is what actuates a relief valve [3]. The dump valve fails from deposit buildup, controller failure, or corrosion [3].
What a Failure-Inclusive Estimate Changes
The first change is that the answer stops being one number [3]. A mechanistic simulator models the probability of a stuck dump valve and the fraction of gas lost when it sticks, then runs the facility repeatedly [3]. The output is a distribution of expected emission ranges [3].
The second change is timing [3]. Wells cycled between shut-in and flowing periods drive correlated behavior through every piece of equipment downstream [3]. A source that looks large on an annual average is really bursts of much higher rate separated by periods of nothing [3]. That variability is what an annual factor cannot carry.
The Failure Also Changes What Comes Out
A stuck dump valve does not only increase the rate [3]. It shifts the composition, because the gas escaping is no longer just tank vapor.
The study’s current facility is a wellpad with three stages of separation [3]. There the four-hour average ethane to methane ratio ran near 0.91 in normal operation [3]. During a stuck dump valve it ran 1.69 [3].
The direction is not universal [3]. For the older two-stage facility the same failure makes the ratio drop, because of the volume flashed in the first separation stage [3]. Across configurations the ratio can vary by a factor of 2.15 [3].
That is why the composition matters to anyone reconciling against a measurement. An aerial or ground survey that samples ethane alongside methane can see the shift [3]. The same logic drives the satellite comparisons described in Why Satellites Show About 2x More Methane Than Inventories.
Why the Study Tested One Failure Mode
The published DJ Basin work exercised one of the five [3]. The authors chose the stuck dump valve specifically to show that a single failure mode can move the result [3]. Failure frequency was set at once per year per last-stage separator, simulated over 365 days with 100 Monte Carlo iterations [3].
The simulator behind that work is the Mechanistic Air Emissions Simulator (MAES) [3]. It is physics-based rather than an AI or machine learning model [3]. The simulation engine was developed at Colorado State University and the University of Texas at Austin [4]. TetraSoft provides commercial access to it through a licence with Colorado State [4]. A component-level treatment of a different equipment type is described in Glycol Pumps: 90% of Uncontrolled TEG Dehydrator Emissions.
Frequently Asked Questions
What are flash emissions from a storage tank?
Flash emissions are gases that come out of solution when pressurized liquid enters a tank at lower pressure [1]. They are not an evaporative loss, which is what separates them from standing and working losses [1]. They occur only in tanks receiving pressurized liquid streams that still contain entrained gas [1]. That describes production tanks fed by a separator, and generally not downstream terminal tanks [1].
Does AP-42 give an equation for flashing losses?
No [1]. AP-42 Chapter 7.1 defines flashing and devotes a section to it, then states that guidance for estimating it is beyond the scope of that section [1]. It points to two families of method instead, one based on a site-specific sample and one based on process simulation [1]. It also notes that a tank with flashing potential still has to be evaluated for routine standing and working losses [1].
Why is my calculated tank number lower than a measured one?
The most common structural reason is that the calculation represents the tank operating as designed. Failure conditions are not in the standard equations, and they are not small [3]. In Colorado’s statewide study, failure events raised the modeled total 52 per cent above the adjusted state inventory [8]. Measurement timing matters too, since a survey captures an instant while an inventory reports an annual average.
What data do I need to model a tank battery mechanistically?
You need the equipment list for the battery, including separation stages, tank count, and control devices. You need throughput, because emissions respond to what actually moved through the facility [3]. You need liquid and gas composition characterized at the last stage separator before the dump valve [1]. Failure frequency and severity for the components can be estimated from field data [3].
Do tank emissions still have to be reported if the federal program changes?
State inventory programs are created by state rulemaking, so they do not depend on the federal reporting program. Colorado’s annual oil and gas inventory reporting is one example, described in Colorado ONGAEIR Due June 30: A Practical Filing Checklist. The federal picture is less settled, because EPA is reconsidering whether to suspend Subpart W reporting for reporting years 2025 through 2034. That status and the current deadline are covered in GHGRP Subpart W Deadline Moved to October 2026.
Interested in building a Measurement-Informed Inventory for your operations? Contact us to learn about our MAES-based estimation services.
References
- EPA AP-42 Chapter 7.1, Organic Liquid Storage Tanks, October 2024. United States Environmental Protection Agency, Compilation of Air Pollutant Emission Factors. https://www.epa.gov/sites/default/files/2020-10/documents/ch07s01.pdf
- UNEP OGMP 2.0 Technical Guidance Document, Unstabilized Hydrocarbon Liquid Storage Tanks, April 2025. Oil and Gas Methane Partnership 2.0. https://www.ogmpartnership.org/sites/default/files/2025-04/Unstabilized-liquid-storage-tanks-TGD-SG-Approved.pdf
- Mollel et al., ACS ES&T Air 2025, 2, 723-735, DOI 10.1021/acsestair.4c00168. Using Prototypical Oil and Gas Sites to Model Methane Emissions in Colorado’s Denver-Julesburg Basin Using a Mechanistic Emission Estimation Tool. https://doi.org/10.1021/acsestair.4c00168
- TetraSoft, MAES Platform. https://tetrasoftco.com/maes-platform/maes-landing.html
- TCEQ Regulatory Guidance RG-622, Calculating Volatile Organic Compounds (VOC) Flash Emissions from Crude Oil and Condensate Tanks at Oil and Gas Production Sites, revised September 2025. Texas Commission on Environmental Quality, Air Permits Division. https://www.tceq.texas.gov/assets/public/permitting/air/Guidance/NewSourceReview/guidance_flashemission.pdf
- KDHE, Acceptable Methods for Calculating Flash Tank Emissions. Kansas Department of Health and Environment fact sheet, undated. https://www.kdhe.ks.gov/DocumentCenter/View/1093/Acceptable-Methods-for-Calculating-Flash-Tank-Emissions-PDF
- LDEQ, Flash Gas Calculation Methods. Louisiana Department of Environmental Quality, undated. https://www.deq.louisiana.gov/page/flash-gas-calculation-methods
- Brown et al., Colorado Ongoing Basin Emissions (COBE) Updated Final Report, November 20, 2025. Colorado State University METEC and Colorado School of Mines, for the Colorado Department of Public Health and Environment. https://metec.colostate.edu/colorado-ongoing-basin-emissions-cobe/
This post is for informational purposes only and does not constitute legal or compliance advice. Consult qualified legal counsel or a compliance professional for guidance specific to your operations and jurisdiction.
Interactive tool
Which flash method does TCEQ accept for your tank?
Nothing leaves your browser. This reports what one document says. It is a starting point, not a permitting determination.
Method list, flowsheet options, and submission requirements from TCEQ Regulatory Guidance RG-622, Calculating Volatile Organic Compounds (VOC) Flash Emissions from Crude Oil and Condensate Tanks at Oil and Gas Production Sites, Air Permits Division, revised September 2025. Texas only. Other states publish their own lists and do not agree with this one: the Kansas fact sheet still makes Vasquez-Beggs its default, and Texas struck that method.
Interactive reference
Where the AP-42 inputs actually come from
Equations 1-2 and 1-37 look usable until you try to fill them in. This resolves every symbol against AP-42's own lookup tables and says which ones no table can give you. Note what is absent: separator pressure appears nowhere, which is why refining any value below cannot recover the flash.
Site values Tables 7.1-6 and 7.1-7
- TAX 63.5 °F
- Average daily maximum ambient temperature tabulated in °F; the equations take °R
- TAN 37.9 °F
- Average daily minimum ambient temperature tabulated in °F; the equations take °R
- ΔTA 25.6 °F
- Average daily ambient temperature range derived as TAX minus TAN; identical in °F and °R
- I 1491 Btu/ft²·day
- Average daily total solar insolation
- PA 12.08 psia
- Atmospheric pressure
- α 0.17 dimensionless
- Tank shell solar absorptance, white in good condition Table 7.1-6
Liquid values Table 7.1-2
- MV 50 lb/lb-mole
- Vapour molecular weight
- ML 207 lb/lb-mole
- Liquid molecular weight
- WL 7.1 lb/gal
- Liquid density
- PVA not tabulated
- True vapour pressure at 60 °F Figure 7.1-16
Every symbol in Equations 1-2 and 1-37 8 inputs
| Symbol | Supplied by | How you get it |
|---|---|---|
| VV Tank vapour space volume ft³ | Tank | From the tank itself: diameter, shell height, and average liquid depth. No table can supply it. |
| WV Stock vapour density lb/ft³ | Liquid + tank | Needs the vapour molecular weight above plus the true vapour pressure at the liquid surface temperature. AP-42 tabulates no vapour pressure for midcontinent crude oil, sending you to Figure 7.1-16. |
| KE Vapour space expansion factor per day | Weather | Built entirely from the six site values above: the 25.6 °F daily range at Denver, CO, the solar insolation, the atmospheric pressure, and the shell absorptance. Nothing about the liquid enters it. |
| KS Vented vapour saturation factor dimensionless | Liquid + tank | KS = 1 / (1 + 0.053 · PVA · HVO), so it needs the vapour pressure and the tank's vapour space outage. Both terms are positive, so it can never exceed 1. |
| VQ Net working loss throughput ft³/yr | Operations | The liquid actually pumped into the tank over the year, from the site record rather than any table. |
| KN Working loss turnover factor dimensionless | AP-42 rule | 1 Fixed for the tanks this post is about: where flashing occurs, AP-42 sets it to 1 regardless of the number of turnovers. |
| KP Working loss product factor dimensionless | AP-42 rule | 0.75 The value AP-42 sets for crude oils. |
| KB Vent setting correction factor dimensionless | AP-42 rule | 1 Applies to open vents and to vent settings up to ±0.03 psig. |
Two of the eight are not lookups at all. The tank's vapour space and the year's throughput come off the tank and the site record. Three are fixed by rule. Only the liquid properties and the weather come from a table, and AP-42's single crude oil entry sends you to a figure rather than publishing a vapour pressure. Where nothing is known about the tank's surface, AP-42's own default is a white shell and roof in good condition.
Values from EPA AP-42 Chapter 7.1, Organic Liquid Storage Tanks, October 2024, Tables 7.1-2, 7.1-6 and 7.1-7.
Comments
0Share your thoughts. All comments are moderated before appearing.
No comments yet. Be the first to share your thoughts!