Under current European Union (EU) law, oil and gas on new or renewed EU contracts must meet a methane intensity cap from August 5, 2030 [1]. Before that, from January 1, 2027, importers must show producer-level monitoring, reporting and verification (MRV) for contracts concluded or renewed since August 4, 2024 [1].
On October 14, 2026, the European Commission proposed postponing the importer MRV and methane intensity deadlines in Articles 28 and 29 by one year [2]. On October 22, 2026, the European Parliament voted 341 to 225 for amendments that would push importers’ first methane intensity reports to August 5, 2031 [3]. For operators in the United States (US) exporting to Europe, the intensity limit turns formula methodology into a market-access issue, whichever date finally applies.
A methane intensity metric divides the methane emitted within a defined boundary by the oil or gas produced or marketed there [4]. Which emissions count in the numerator, and which volume goes in the denominator, can change the result for identical emissions. A February 2026 Clean Air Task Force (CATF) report shows formula choice changes reported intensity, and one numeric threshold has unequal stringency for oil and gas [4]. CATF describes itself as a climate solutions organization [5].
The EU must set separate maximum values for crude oil and gas, but splitting a producer’s emissions between them is itself a formula choice. This guide explains why the denominator choice matters, what the EU regulation requires and leaves open, and why factor-based inventories undercount the numerator. A closing FAQ covers each EU milestone, flared gas, and OGMP 2.0, a United Nations methane reporting framework. The audience is US producers, exporters and compliance teams selling into Europe, and no background in emissions accounting is assumed.
The Denominator Problem: Marketed Gas vs. Total Hydrocarbon Production
A gas-only denominator inflates methane intensity for oil-dominant producers, because modest emissions divided by a small gas volume give an extreme figure. The Oil and Gas Climate Initiative (OGCI) is a CEO-led organization of 12 of the largest oil and gas companies worldwide [6]. OGCI defines upstream methane intensity as methane emissions from operated assets divided by total gas marketed (OGCI Reporting Framework, 2023) [7].
The boundary extends up to the first point of sale [7]. Marketed gas is the volume a company distributes to the market, sold or supplied free of charge, measured at that point of sale [7]. OGCI defines the point of sale as the place or device where ownership of the product transfers to the downstream player [7].
Gas that is flared, vented, burned as on-site fuel, or reinjected is not marketed, so it falls outside the denominator. Gas processed under a tolling agreement is excluded from the marketed volume, because the toller keeps ownership (OGCI Reporting Framework, 2023) [7]. The methane emitted while processing it still counts in the numerator [7].
OGCI set a combined membership target of “well below 0.20%” intensity by 2025, measured against this marketed-gas denominator (OGCI, 2023) [8]. Members reached the target in 2021, four years early (OGCI, 2026) [6]. For 2024, OGCI reported an aggregate upstream operated methane intensity of 0.12% (OGCI, 2026) [6].
OGCI puts that figure 62% below 2017 and 14% lower year on year, though its unrounded 0.144% and 0.115% imply about 20% (OGCI, 2026) [6]. OGCI’s CEOs have said they aim for a collective methane intensity of 0.1% by 2030 (OGCI, 2026) [6].
Clearing the target says less than the headline suggests. The 0.12% aggregates data reported by the 12 members, most of which have it independently verified, and excludes partner-operated assets (OGCI Reporting Framework, 2023) [7]. The aggregate therefore describes a subset of world production, computed with whatever numerator method the members used.
CATF names two caveats specific to a gas-only denominator (CATF, 2026) [4]. One is “Product Volume Bias”: for the same emissions, a producer that markets more gas records a lower intensity (CATF, 2026) [4]. The other is “Limited Applicability”: intensity “cannot be calculated for producers that do not produce the selected product” (CATF, 2026) [4].
One alternative approach uses total hydrocarbon production, converted to a common energy unit, as the denominator [4]. CATF expresses such denominators in units of energy or of oil equivalent, for example gigajoules, megajoules, or barrels of oil equivalent (CATF, 2026) [4].
CATF reviews the competing formulas and does not recommend any one of them (CATF, 2026) [4]. An energy-equivalent denominator puts oil and gas in one unit, but CATF finds distortions between oil-heavy and gas-heavy producers may remain.
What the EU Methane Regulation Requires and What Remains Undefined
The EU Methane Regulation (EU/2024/1787) has been in force since August 4, 2024, yet its maximum methane intensity value and calculation methodology are still unset [1]. Article 29(2) requires meeting maximum methane intensity values from August 5, 2030 [1]. The obligation covers supply contracts concluded or renewed after that date [1].
Article 29(4) sets a deadline of August 5, 2027 for the delegated act carrying the methodology (EU/2024/1787) [1]. From January 1, 2027, importers must demonstrate equivalent monitoring, reporting and verification at producer level (EU/2024/1787) [1]. The duty covers contracts concluded or renewed on or after August 4, 2024 [1]. Annual methane intensity reporting begins August 5, 2028 [1].
The methodology the EU selects can change which operators pass and which fail, independent of any physical change in their emissions.
Will the EU Postpone the Importer Deadlines?
Possibly, since a postponement of the regulation’s importer dates is now being negotiated. Until an amending act enters into force, the dates in the regulation still apply.
| Date | Action | Status |
|---|---|---|
| August 4, 2024 | Regulation (EU) 2024/1787 enters into force | In force [1] |
| July 20, 2026 | Recommendation (EU) 2026/1835 asks Member States not to apply certain importer penalties for obligations due 2027-2029 | Guidance only; obligations stay in force [9] |
| October 14, 2026 | Commission proposes COM(2026) 569, postponing importer MRV and methane intensity provisions by one year | Proposal [2] |
| October 22, 2026 | Parliament votes 341 to 225 for longer delays and sends the file to negotiations with the Council | Pending [3] |
| Due August 5, 2027 | Delegated act setting the intensity methodology | Not yet adopted |
US suppliers can follow these changes on the Commission’s Methane Regulation import requirements page. The negotiation is about dates and leaves the formula question open.
Why Factor-Based Inventories Compound the Methodology Problem
Measurement studies find the EPA’s national inventory understates oil and gas methane, often by missing large emitters, a numerator problem separate from the denominator choice. Operators reporting under Subpart W build part of their methane numbers from bottom-up inventories that apply default emission factors [10].
Subpart W is the petroleum and natural gas systems section of 40 CFR Part 98 [10]. 40 CFR Part 98 is the federal regulation that sets the US Environmental Protection Agency (EPA) Greenhouse Gas Reporting Program [10]. Subpart W prescribes source-specific calculation methods rather than one formula [10]. They range from direct metering and leak measurement through engineering estimation to default emission factors [10].
Where no measurement exists, an equipment count multiplied by a published factor produces the annual total (40 CFR Part 98, Subpart W) [10]. In September 2025, EPA proposed ending most of the program and suspending Subpart W reporting until 2034 (90 FR 44591); only deadline extensions are final [11]. FR refers to the Federal Register, which the National Archives calls the daily journal of the federal government [12].
Reports for the 2025 year are due March 10, 2027, after two extensions (91 FR 9712; 91 FR 65112) [11]. EPA’s rulemaking notices page lists that October 14, 2026 extension as its latest action, with no final reconsideration rule [13].
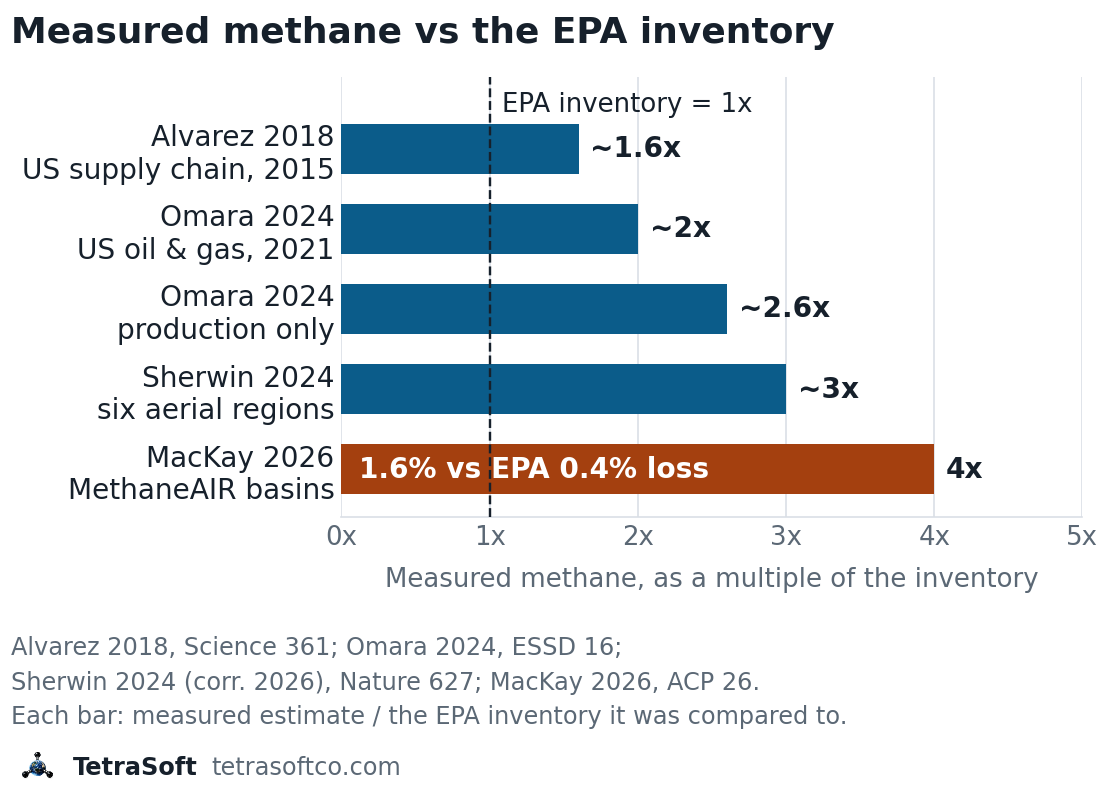
Three recent peer-reviewed studies size the gap. Omara et al. (2024) built a measurement-based national inventory from 1,540 facility measurements [14]. Their 2021 estimate is about 16 Tg, roughly 2x the EPA Greenhouse Gas Inventory [14]. Their estimate for the production sector alone, about 9 Tg, is roughly 2.6x the inventory’s production-related figure [14].
Sherwin et al. (2024) integrated about one million aerial site measurements across six US regions [15]. After a 2026 author correction, their six-region weighted average is 2.43% of covered gas production, roughly three times the national government inventory estimate [15].
MacKay et al. (2026) report a MethaneAIR loss rate of 1.6% of gross gas production, more than four times EPA’s 0.4% for the same regions [16]. Basin-level MethaneAIR oil and gas emissions run from 1.3x (Barnett) to 7.9x (Greater Green River) the corresponding EPA estimates [16].
The earliest study in this series found a smaller gap. Alvarez et al. (2018) put 2015 supply chain emissions at 13 Tg per year, about 60% above the EPA inventory [17]. The later studies differ in method, year and scope, so their larger multiples do not show a trend. Each later study’s headline estimate is roughly twice the inventory or more, though MacKay’s basin ratios start at 1.3x.
The chart shows each study’s measured estimate as a multiple of the EPA inventory it compared against; MacKay’s bar uses loss rates. Every bar sits to the right of the dashed inventory line, though the studies’ scopes, years and baselines differ.
TROPOMI is the spectrometer aboard the Sentinel-5P satellite, and it maps methane and other trace gases across the globe every day [18]. TROPOMI inversions agree, putting 2018-2020 US oil and gas methane 80% above the EPA inventory, with basin gaps varying (Shen et al., 2022) [19]. Our analysis of why satellites show more methane than inventories compares those basin results in more depth.
When an intensity metric divides an undercounted numerator by a contested denominator, the resulting number is uncertain in two independent dimensions. If measurement doubled an operator’s factor-based emissions estimate, a reported 0.15% of marketed gas would become about 0.30%.
How Does a Measurement-Informed Inventory Fix the Numerator?
TetraSoft MAES, our emissions estimation service, simulates real equipment behavior, including failures and throughput changes [20]. It runs the Mechanistic Air Emissions Simulator, developed at Colorado State University and UT Austin [21]. MAES models emissions from fluid flow through equipment and from equipment states (Mollel et al., 2025) [22].
MAES converts its second-by-second estimates into a probability distribution, giving an expected emission range for each simulated site (CSU METEC) [23]. TetraSoft uses MAES through a partnership with Colorado State University [21].
Santos et al. (2025), coauthored by TetraSoft cofounders Arthur Santos (first author) and Jerry Duggan, state that annual operator inventories likely omit failure-event emissions [24]. Santos et al. (2025) estimate “an additional 16.4% of total emissions from abnormal events” for the Denver-Julesburg Basin, using MAES with aerial survey data [24].
A Measurement-Informed Inventory (MII) built on MAES adds abnormal-event emissions characterized from aerial and field measurements (Santos et al., 2025) [24]. Its numerator calibrates simulated equipment behavior to reported inventories, then adds abnormal-event statistics from field surveys, rather than relying on factor tables alone. For operators preparing to demonstrate methane intensity to European buyers, the numerator methodology matters as much as the denominator formula. Auditable, measurement-based emissions data supports EU verification under any formula, though it may raise reported intensity.
Frequently Asked Questions
What is methane intensity and how is it calculated?
Methane intensity is a ratio that expresses methane emissions as a proportion of production volume [7]. The numerator is total methane emitted (in volume or mass units) from a defined operational boundary [7]. The denominator varies by framework: some use marketed natural gas volume, others use total hydrocarbon production converted to energy-equivalent units [4].
Energy-equivalent denominators use units such as gigajoules or million tonnes of oil equivalent, written Mtoe [7]. The choice of denominator can change calculated intensity and distort comparisons, especially between oil-dominant and gas-dominant producers [4].
How should US exporters prepare for each EU methane regulation milestone?
The January 2027 MRV equivalence date still applies unless an amendment is adopted, so exporters should check their MRV documentation against EU criteria now. For the August 2028 intensity reporting start, which the Commission’s proposal would move to 2029, operators need a methodology and baseline data in advance. Operators can model their intensity now under marketed-gas, produced-gas and energy-weighted formulas to gauge exposure before the August 2030 limit. Operators should also assess whether their emissions numerator is defensible under measurement-based scrutiny.
How are flared and vented volumes treated in each denominator formula?
The marketed-gas denominator excludes gas that is flared, vented, or consumed on-site, counting only gas reaching the point of sale. An energy-equivalent denominator based on total production may include those volumes depending on framework-specific boundary definitions. For operators with high flaring rates, the gap widens if the energy denominator counts produced volumes, because flaring shrinks only the marketed-gas denominator. The EU has not yet specified which boundary definition will apply to the import intensity standard.
Does OGMP 2.0 reporting satisfy the EU methane regulation?
For importers, OGMP 2.0 Level 5 reporting is one named route to the producer-level MRV equivalence the regulation requires [9]. The Commission’s question-and-answer page says producers can meet the 2027 terms by reaching Level 5 by January 2027 and having their methane data independently verified [9].
OGMP 2.0 is the flagship oil and gas methane reporting programme of the United Nations Environment Programme, built on measurement [25]. Building a Measurement-Informed Inventory now gives lead time before the EU threshold binds; OGMP 2.0 Level 5 reporting also needs independent site-level measurement.
This post is for informational purposes only and does not constitute legal or compliance advice. Consult qualified legal counsel or a compliance professional for guidance specific to your operations and jurisdiction.
Interested in building a Measurement-Informed Inventory for your operations? Contact us to learn about our MAES-based estimation services.
References
- Regulation (EU) 2024/1787 of the European Parliament and of the Council on the reduction of methane emissions in the energy sector, OJ L, 15 July 2024, in force 4 August 2024. https://eur-lex.europa.eu/eli/reg/2024/1787/oj.
- European Commission, Proposal amending Regulation (EU) 2024/1787 as regards the postponement of certain obligations, COM(2026) 569 final, 2026/0325(COD), October 14, 2026.
- European Parliament, Legislative Observatory, procedure file 2026/0325(COD). https://oeil.europarl.europa.eu/oeil/en/procedure-file?reference=2026%2F0325%28COD%29. Accessed November 3, 2026.
- Clean Air Task Force (CATF), “Methane intensity for oil and gas production: Key methodological considerations,” February 2026. https://www.catf.us/resource/methane-intensity-oil-gas-production/.
- Clean Air Task Force, “About.” https://www.catf.us/about/. Accessed November 3, 2026.
- OGCI, “OGCI’s methane intensity target.” https://www.ogci.com/methane-emissions/methane-intensity-target/. Accessed November 3, 2026.
- OGCI Reporting Framework, Final Version, October 2023. https://www.ogci.com/wp-content/uploads/2023/11/OGCI_Reporting_Framework_2023_-_FINAL_FINAL.pdf.
- OGCI, “Aiming for Zero Methane Emissions Initiative,” Guidance on Near-Zero Methane Emissions, 2023. https://www.ogci.com/wp-content/uploads/2023/08/OGCI-guidance-on-near-zero-methane-emissions.pdf.
- European Commission, Directorate-General for Energy, “Methane Regulation import requirements.” https://energy.ec.europa.eu/topics/carbon-management-and-fossil-fuels/methane-emissions/methane-regulation-import-requirements_en. Accessed November 3, 2026.
- EPA Greenhouse Gas Reporting Program, Subpart W, Petroleum and Natural Gas Systems, 40 CFR Part 98, Subpart W (sections 98.230 to 98.238 and Tables W-1 to W-7).
- EPA, “Reconsideration of the Greenhouse Gas Reporting Program,” proposed rule, 90 FR 44591, September 16, 2025; “Extending the Reporting Deadline Under the Greenhouse Gas Reporting Rule for 2025,” 91 FR 9712, February 27, 2026; “Extending the Reporting Deadline Under the Greenhouse Gas Reporting Rule for Reporting Year 2025 to March 10, 2027,” interim final rule, 91 FR 65112, October 14, 2026.
- National Archives, Office of the Federal Register, “About the Federal Register.” https://www.archives.gov/federal-register/the-federal-register/about.html. Accessed November 3, 2026.
- US EPA, “Rulemaking Notices for GHG Reporting.” https://www.epa.gov/ghgreporting/rulemaking-notices-ghg-reporting. Accessed November 3, 2026.
- Omara, M., Himmelberger, A., MacKay, K., et al. “Constructing a measurement-based spatially explicit inventory of US oil and gas methane emissions (2021).” Earth System Science Data, Vol. 16, pp. 3973-3991, 2024. DOI: 10.5194/essd-16-3973-2024.
- Sherwin, E. D., Rutherford, J. S., Zhang, Z., et al. “US oil and gas system emissions from nearly one million aerial site measurements.” Nature, Vol. 627, pp. 328-334, March 13, 2024; Author Correction, May 29, 2026. DOI: 10.1038/s41586-024-07117-5.
- MacKay, K., Benmergui, J., Williams, J. P., et al. “Assessment of methane emissions from US onshore oil and gas production using MethaneAIR measurements.” Atmospheric Chemistry and Physics, Vol. 26, pp. 1179-1192, 2026. DOI: 10.5194/acp-26-1179-2026.
- Alvarez, R. A., Zavala-Araiza, D., Lyon, D. R., et al. “Assessment of Methane Emissions from the U.S. Oil and Gas Supply Chain.” Science, Vol. 361, Issue 6398, pp. 186–188, July 13, 2018. DOI: 10.1126/science.aar7204.
- European Space Agency, “Introducing Sentinel-5P.” https://www.esa.int/Applications/Observing_the_Earth/Copernicus/Sentinel-5P/Introducing_Sentinel-5P. Accessed November 3, 2026.
- Shen, L., Gautam, R., Omara, M., et al. “Satellite quantification of oil and natural gas methane emissions in the US and Canada including contributions from individual basins.” Atmospheric Chemistry and Physics, Vol. 22, pp. 11203-11215, 2022. DOI: 10.5194/acp-22-11203-2022.
- TetraSoft, “MAES” landing page. https://tetrasoftco.com/maes-platform/maes-landing.html. Accessed November 3, 2026.
- TetraSoft corporate disclosure; MAES developed at Colorado State University and UT Austin and used by TetraSoft under partnership with Colorado State University.
- Mollel, W., Zimmerle, D., Santos, A., & Hodshire, A. “Using Prototypical Oil and Gas Sites to Model Methane Emissions in Colorado’s Denver-Julesburg Basin Using a Mechanistic Emission Estimation Tool.” ACS ES&T Air, Vol. 2, Issue 5, pp. 723-735, 2025. DOI: 10.1021/acsestair.4c00168.
- Colorado State University METEC, “Measurement Informed Inventory.” https://metec.colostate.edu/measurement-informed-inventory/. Accessed November 3, 2026.
- Santos, A., Mollel, W., Duggan, G. P., Hodshire, A., Vora, P., & Zimmerle, D. “Using Measurement-Informed Inventory to Assess Emissions in the Denver-Julesburg Basin.” ACS ES&T Air, Vol. 2, Issue 8, pp. 1598-1611, 2025. DOI: 10.1021/acsestair.5c00089.
- OGMP 2.0, homepage. https://ogmpartnership.org/. Accessed November 3, 2026.
- European Commission, Directorate-General for Energy, “Methane emissions.” https://energy.ec.europa.eu/topics/carbon-management-and-fossil-fuels/methane-emissions_en. Accessed November 3, 2026.
Comments
0Share your thoughts. All comments are moderated before appearing.
No comments yet. Be the first to share your thoughts!