OGMP 2.0 is the United Nations Environment Programme’s measurement-based reporting framework for oil and gas methane, and it sorts emissions data into five levels [1]. Levels 1 through 3 describe how finely a company breaks its inventory down, from a whole asset to a single emission source [1]. Level 4 and Level 5 change the question entirely, because both ask where the number came from rather than how finely it was divided [1]. Level 4 requires source-level estimates specific to the operator’s own equipment, built from measurement, engineering calculation, or process simulation [1]. Level 5 requires measuring the whole site as well, then reconciling the two estimates statistically and reporting the uncertainty that survives [1].
Quick Answer: OGMP 2.0 Level 4 requires source-level emission estimates built from measurement, engineering calculation, or process simulation instead of generic factors. Level 5 adds site-level measurement of the same asset plus a statistical reconciliation of the two estimates. Reporting all material assets at Level 4 and Level 5 is what earns Gold Standard Reporting [2]. The deadline is three years for operated assets and five for non-operated ventures [2].
What the Five OGMP 2.0 Reporting Levels Require
The five levels move along two different axes, and confusing them is the most common reason operators misjudge how far they are from Gold Standard. Levels 1 to 3 refine scope, narrowing the unit of accounting from an asset, to an emission category, to an individual emission source [1]. Levels 3 to 5 refine the measurement itself, moving from a generic factor to source measurement to site-level measurement with a stated uncertainty [1].
Read the table down the last two columns rather than across the rows. The unit of accounting stops changing after Level 3, and the measurement basis stops changing only at Level 5 [1].
| Level | Unit of accounting | What the estimate is built from | Your own equipment measured? | Site-level measurement? |
|---|---|---|---|---|
| 1 | Country, venture, asset, or facility | Activity factor times a generic emission factor | No | No |
| 2 | Emission category, such as venting or flaring | Generic factor specific to that category | No | No |
| 3 | Individual emission source | Generic source-level emission factors | No | No |
| 4 | Individual emission source | Measurement-based factors, engineering calculation, or process simulation | Yes | No |
| 5 | Whole site, reconciled against sources | Sum of Level 4 estimates reconciled with site-level measurement | Yes | Yes |
Two things follow from the last two columns. Levels 1 to 3 are a bookkeeping exercise, because every one of them still rests on a factor somebody else derived [1]. Level 4 is the first level that requires an operator to characterise its own equipment [1]. Level 5 is the only level requiring an independent observation of the site as a whole [1].
A company sitting at Level 3 has already done the hard inventory work of naming every source. What it has not done is replace the generic factor attached to each one [1]. That substitution is the entire step.
The 14 Core Emission Sources That Define Level 3
Level 3 reporting is organized around 14 core emission sources named by the framework [1]. Seven cover operations: gas well hydraulic fracturing, oil well casinghead, purging and venting, incidents and malfunctions, liquids unloading, incomplete combustion, and flare efficiency [1]. The other seven cover equipment: reciprocating compressors, centrifugal compressors, leaks, unstabilized liquid storage tanks, underground pipe leaks, pneumatic devices, and glycol dehydrators [1].
That list is worth reading as a checklist rather than a taxonomy. An operator that cannot produce an activity count for one of the 14 has a gap that Level 4 will expose rather than fix.
What Actually Changes Between Level 4 and Level 5
Level 4 is a statement about your own equipment, and Level 5 is a statement about whether that equipment list adds up. At Level 4 the framework accepts measurement-based emission factors drawn from a representative sample, the results of engineering calculations, and the results of process simulation [1]. Each source can be handled by whichever of those methods suits it [1]. The accepted methodologies are set out source by source in the framework’s technical guidance [1].
Level 5 then measures the site as a whole and compares that against the sum of the Level 4 estimates [1]. The framework asks for a statistical analysis that determines the best consolidated estimate and its uncertainty [1]. It must also explain any discrepancy [1]. Findings may then be extrapolated to similar facilities operating under similar conditions [1].
Reconciliation Is the Part That Fails
The reconciliation step is where Level 5 gets expensive, because the two estimates rarely agree. The framework requires that gap to be explained rather than averaged away. A site-level measurement that comes in above the source-level sum means something is emitting that the inventory does not contain.
Explaining that gap is a modeling problem, not a measurement problem. The usual culprits are conditions a design-state inventory does not represent, including equipment operating in a failed state and throughput that varies over the year [3].
What You Need in Hand Before Attempting Level 5
Four inputs have to exist before a Level 5 attempt is worth funding. The first is a complete equipment inventory at the source level, which is the Level 3 foundation [1]. The second is throughput data, because a source-level model responds to what actually moved through the facility.
The third is gas composition for the streams involved, since methane is a fraction of what a source releases and that fraction shifts by facility [3]. The fourth is the site-level measurement campaign itself, which no amount of operational record-keeping can substitute for. Colorado’s statewide program obtained its site-level data from aerial survey vendors flying more than 30,000 individual facility scans [4].
Where Factor-Based Inventories Fall Short
Published reconciliations keep finding the same thing, which is that source-level inventories built from generic factors sit below what site-level measurement sees [4]. Colorado’s statewide study is the largest reconciliation of that kind carried out so far. It is worth reading closely, because it was built on operator-reported data of the sort a Level 4 submission rests on.
Working from 2024 reported data, it put the mechanistic model’s statewide total at 1.47 times the reported inventory [4]. Two figures come out of that work, and they answer different questions. The 1.47 ratio compares the full modelled total against everything operators reported [4]. The second comparison sets maintenance emissions aside, because the model does not represent them [4]. Against that adjusted inventory, the measurement-informed total sits 52 per cent higher [4]. That 52 per cent increment is attributed to failure events rather than to normal operation [4].
That increase varied by basin, at 58 per cent in the Denver-Julesburg and 27 per cent in the Piceance [4]. Across all other basins it was 53 per cent [4]. The same pattern appears from orbit, as covered in Why Satellites Show About 2x More Methane Than Inventories.
Reconciliation Needs a Mechanism, Not Just a Number
Level 5 does not ask an operator to produce a bigger number [1]. It asks them to reconcile a source-level inventory against a site-level measurement, which means accounting for why the two differ [1]. A reconciliation that closes the gap with an unexplained scaling factor satisfies the arithmetic and not the requirement.
This is the specific problem a measurement-informed inventory solves [4]. It is built by taking a source-level inventory and adding back the aerial detections the reported inventory missed [4]. Each detection is attributed to a cause before it is included [4]. The value of that exercise is not the ratio it produces. It is that the additional emissions are attributed to identified sources and mechanisms, which is what a Level 5 submission has to show [4].
The mechanism is what makes that attribution possible. The model represents equipment in failed states rather than only in design states [4]. That lets the gap between the reported inventory and the site-level measurement resolve into named failure modes at named equipment [4]. Failure modes are not the whole of it, because a reporting rule can also leave real sources out of scope. Older Subpart W vintages did not require methane from produced water tanks or compressor crankcase vents. Both sat outside the reported total while still emitting. An operator reading that has somewhere to go next, because a failure mode is something to find and fix.
Two practical cautions belong with it. Reconciliation is not a formality applied after the measurement campaign, and treating it as one is how Level 5 timelines slip. Different methods applied to the same measurements can also produce materially different totals, so the method and its assumptions are part of what gets reported [4].
Where the MAES Platform Fits
Process simulation is one of the methods the framework accepts at Level 4 [1]. That is the opening a simulator fills.
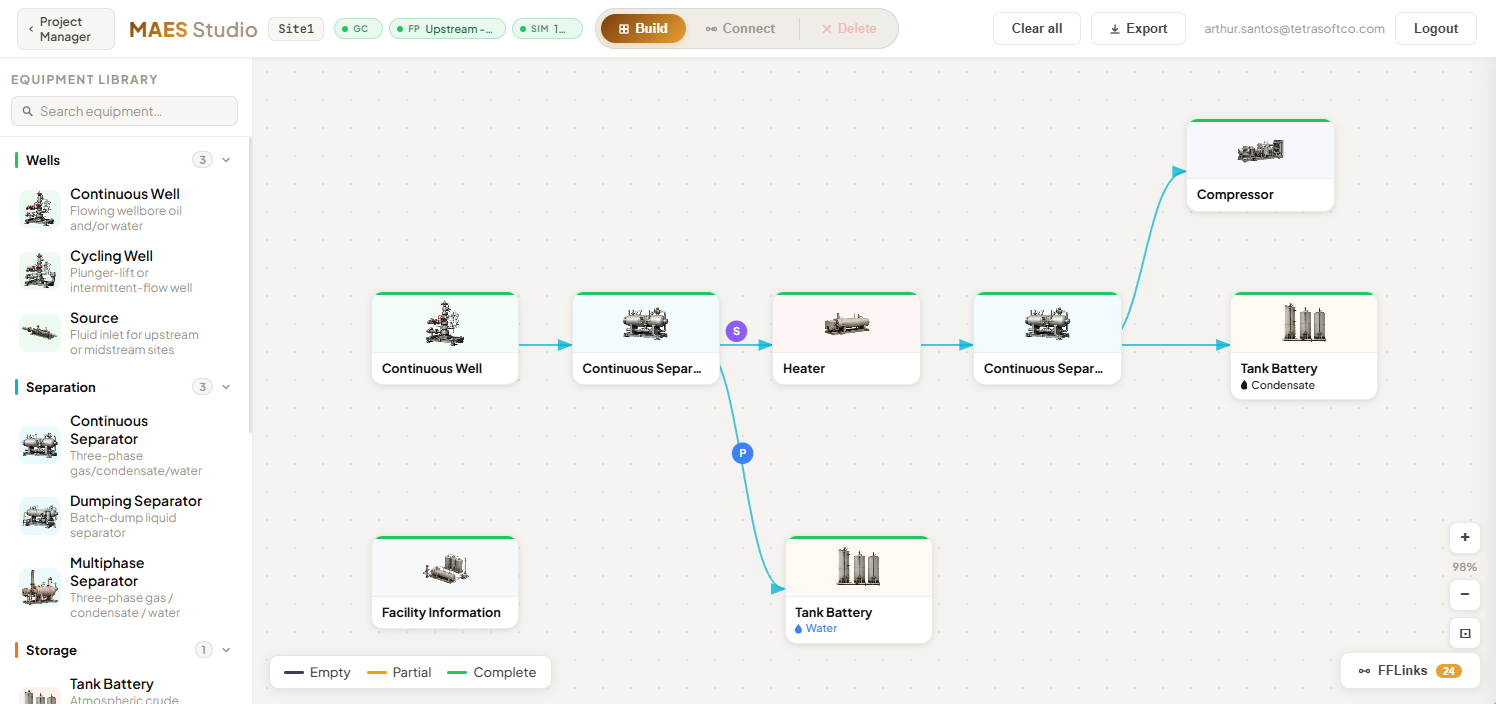
TetraSoft’s MAES Platform is built around that opening [5]. It is a product an operator can run directly, on their own facilities and their own schedule [5]. An operator loads a facility’s equipment inventory, gas composition, and operating parameters through MAES Studio [5]. The platform then runs the Monte Carlo simulation of that configuration in the cloud [5]. No field measurement hardware is needed for a baseline run, because the inputs are equipment, composition, and operating records rather than new field data [5].
Two properties matter to whoever assures the submission. The platform is not an AI or machine learning model, so every result traces back to a physical equation rather than to a fitted pattern [3]. The methodology is published rather than proprietary, so a third party given the same inputs can reproduce the same outputs [3]. The measurement-informed inventory method itself is peer reviewed, published in ACS ES&T Air in 2025 [6]. That paper sets out how the simulator reconciles an inventory against aerial measurements by characterising failure events with site-specific information [6].
Under the hood it applies two methods rather than one [3]. Mechanistic models handle compressor exhaust, flare combustion and slip, open tank vents and hatches, and overpressure in atmospheric storage tanks [3]. What that flare combustion term assumes, and how far real units fall from it, is set out in Oil and Gas Flaring: What Flares Actually Destroy. Activity-times-factor methods handle component leaks, pneumatic controllers, well completions, and compressor seal vents [3]. The mechanistic side is what represents equipment operating in a failed state [3]. A comparable component-level treatment of one source type is described in Glycol Pumps: 90% of Uncontrolled TEG Dehydrator Emissions.
The simulation engine was developed at Colorado State University and the University of Texas at Austin [5]. TetraSoft provides commercial access to it through a licence with Colorado State [5]. It is the same engine used for the Colorado statewide work cited throughout this post [4]. An operator running the platform is running a method a state regulator has already seen applied at scale.
Field measurement is an option from there rather than a prerequisite, because the simulation alone already meets the Level 4 basis. Feeding an operator’s own measurements into the same model is what turns it into a measurement-informed inventory [6]. That is the reconciliation half of Level 5, not a substitute for it. Gold Standard reporting still requires source-level data reconciled against site-level measurements [7]. The measurement campaign is the part a model cannot replace, and the model is the part a measurement cannot supply on its own.
What the Platform Produces Before Any Survey
The model-only case earns its keep before any survey is flown. It ranks a site’s own equipment by contribution, so an operator can see which sources dominate their total rather than assuming [5]. That ranking is what makes mitigation spending targetable, because the largest contributor is named rather than inferred.
The platform also puts a number on it [5]. It runs a financial analysis over the simulated results, valuing the modelled methane loss at market gas price as an annual figure [5]. It then splits that total into the share available technology can remove and the share it cannot [5]. Heater firing and the flare combustion floor sit on the non-addressable side [5].
Tank thief-hatch leaks and gas-driven glycol pump flash sit on the addressable side, each carrying the action that removes it [5]. Routing tank vapours to a vapour recovery unit and swapping a gas-driven glycol pump for an electric one are two such actions [5]. The same analysis ranks sites by addressable methane, so a fixed budget goes where the recoverable value is largest [5].
The walkthrough above scrolls the whole analysis, from the headline gas-value and recovery figures through the per-source mitigation actions to the site ranking [5].
The same ranking also tells an operator where measurement is worth paying for. That matters when a survey campaign has to be scoped across a fleet rather than a single pad.
What comes back is not a single number [5]. The platform returns a P5, mean, and P95 distribution across 35 interactive plots in five tabs [5]. The plots break out which equipment types contribute most and how failure events move the profile [5]. Emissions from failure modes are reported as a category distinct from routine baseline emissions [5]. The split arrives as an output of the run rather than something assembled by hand afterwards.
Explaining the Gap Between Your Inventory and the Aerial Number
The reconciliation problem an operator actually faces is narrow. A survey vendor returns a site-level number, the reported inventory sits below it, and someone has to say why [1]. The platform is built for that comparison directly [5]. It sets a MAES-based facility estimate against the inventory already reported to a regulator, and shows where the difference sits [5].
The difference lands on equipment, which is what makes it actionable. MAES carries physics-based models for wells, separators, storage tanks and tank batteries, compressors, heaters, flares, dehydrators, vapour recovery units, and pneumatic devices [5]. It also models the abnormal events that drive the largest gaps, including stuck dump valves, pressure relief valve actuations, thief hatch failures, and vent failures [5]. A stuck dump valve alone shifts the C2/C1 ratio of the released gas from 0.91 to 1.69 [5]. That kind of signature turns an unexplained gap into a specific component to inspect.
One limitation belongs in any honest plan. In the Colorado work the model could only be run for 81 per cent of operating reported facilities [4]. The remaining 19 per cent were missing key information in the reported data [4]. Data readiness, not modeling capability, was the binding constraint on coverage.
Frequently Asked Questions
Is OGMP 2.0 mandatory?
OGMP 2.0 is a voluntary partnership that companies join, rather than a regulation that applies automatically [2]. Members commit to setting a reduction target, reporting annually, and improving data quality over time [2]. The obligations become binding once a company joins, and the framework applies independent assurance to implementation plans and reported data [7]. Separately, Regulation (EU) 2024/1787 has built parts of the framework into binding European law [8].
What is OGMP 2.0 Gold Standard Reporting?
Gold Standard Reporting is awarded to companies pursuing the highest reporting level, which is Level 5 [7]. It requires reconciliation of source-level emissions data with site-level measurements, within the prescribed timelines, for all material assets [7]. Material assets are those accounting for 95 per cent of a given operator’s total emissions, so the obligation is weighted rather than universal [7]. Companies have three years to reach it for operated assets and five years for non-operated ventures [7].
Who are the OGMP 2.0 members, and how many assets reach Level 5?
OGMP 2.0 has expanded to nearly 160 member companies covering around 45 per cent of global oil and gas production [7]. Membership spans upstream, midstream, and downstream operators, including public, private, and national oil and gas companies [2]. In 2024, assets at Level 5 accounted for 7 per cent of global production, corresponding to 238 assets [7]. Those assets reported a methane intensity of around 0.1 per cent in energy terms [7].
How does OGMP 2.0 relate to the EU Methane Regulation?
Regulation (EU) 2024/1787 builds on parts of the OGMP 2.0 framework and adopts its reporting-level vocabulary directly [8]. Its recitals describe source-level reporting as beginning at level 3, level 4 as requiring direct measurements, and level 5 as requiring complementary site-level measurements [8]. The practical consequence is that work done for OGMP 2.0 is not separate from European market access. Operators selling into the European Union face the regulation whether or not they join the partnership [8].
Does Level 4 require measuring every single source?
No, because the framework accepts measurement-based emission factors derived from a representative sample rather than a census [1]. Engineering calculations and process simulation results are also accepted at Level 4 [1]. What the framework does not accept at Level 4 is a generic factor that is not specific to the operator’s own equipment [1]. The accepted methodology is specified source by source in the technical guidance documents [1].
Interested in building a Measurement-Informed Inventory for your operations? Contact us to learn about our MAES-based estimation services.
References
- UNEP OGMP 2.0 Module 2, The OGMP 2.0 reporting levels, August 2025. https://www.ogmpartnership.org/sites/default/files/resources/2025-08/OGMP%20module%20-%202.pdf
- UNEP OGMP 2.0 Module 1, Introduction to OGMP 2.0 reporting and mitigation framework, August 2025. https://www.ogmpartnership.org/sites/default/files/resources/2025-08/OGMP%20module%20-%201.pdf
- Mollel et al., ACS ES&T Air 2025, 2, 723-735, DOI 10.1021/acsestair.4c00168. Using Prototypical Oil and Gas Sites to Model Methane Emissions in Colorado’s Denver-Julesburg Basin Using a Mechanistic Emission Estimation Tool. https://doi.org/10.1021/acsestair.4c00168
- Brown et al., Colorado Ongoing Basin Emissions (COBE) Updated Final Report, November 20, 2025. Colorado State University METEC and Colorado School of Mines, for the Colorado Department of Public Health and Environment. https://metec.colostate.edu/colorado-ongoing-basin-emissions-cobe/
- TetraSoft, MAES Platform. https://tetrasoftco.com/maes-platform/maes-landing.html
- Santos et al., ACS ES&T Air 2025, 2, 1598-1611, DOI 10.1021/acsestair.5c00089. Using Measurement-Informed Inventory to Assess Emissions in the Denver-Julesburg Basin. https://doi.org/10.1021/acsestair.5c00089
- UNEP OGMP 2.0, OGMP 2.0 Level 5 Assessment, March 2026. https://www.ogmpartnership.org/sites/default/files/resources/2026-03/OGMP%202.0%20Level%205%20Assessment.pdf
- Regulation (EU) 2024/1787 of 13 June 2024 on the reduction of methane emissions in the energy sector. https://eur-lex.europa.eu/eli/reg/2024/1787/oj/eng
This post is for informational purposes only and does not constitute legal or compliance advice. Consult qualified legal counsel or a compliance professional for guidance specific to your operations and jurisdiction.
Comments
0Share your thoughts. All comments are moderated before appearing.
No comments yet. Be the first to share your thoughts!