Flaring burns associated gas that cannot be sold, moved, or reinjected, converting most of its methane to carbon dioxide before release [1]. The emissions credited to a flare are therefore not the gas sent to it, but the small fraction that survives combustion [1]. Every published flare emission factor rests on an assumption about how much of that gas the flare actually destroys. The assumption is a high one, generally at least 98 percent, and it is stated openly in the source documents [1]. What no factor covers is the flare that is unlit, undersized, or running outside the envelope those tests were performed in.
Vented gas leaves as methane rather than carbon dioxide [1]. A volume of vented gas therefore carries far more warming effect than the same volume flared. That difference is the whole reason flaring exists as a disposition route. It also makes the destruction figure the number that decides whether the choice paid off.
Quick Answer: AP-42 scopes its flare emission factors to units achieving at least 98 percent destruction efficiency [1]. Airborne sampling offshore measured a median methane destruction of 98.5 percent [2]. Across three US basins the effective figure was 91.1 percent once unlit flares were counted [3]. For a specific flare, Subpart W Equation W-19 is the prescribed route to a methane number [4].
What the AP-42 Flare Factors Actually Cover
The published factors are narrow, and their footnotes are where the conditions live. The same pattern holds across the other source types, catalogued in AP-42 Emission Factors by Source Type, and What They Assume. Flare factors represent emissions exiting the flare, because a flare is a control device rather than the originating source [1]. EPA warns they may not be appropriate for estimating the uncontrolled emissions routed to the flare [1]. The table below uses THC for total hydrocarbons, VOC for volatile organic compounds and NOx for nitrogen oxides [1].
| Flare type | Pollutant | Factor | Grade |
|---|---|---|---|
| Elevated flare | VOC | 0.66 lb/10⁶ Btu | Poorly representative |
| Elevated flare | CO | 0.31 lb/10⁶ Btu | Poorly representative |
| Elevated flare | THC | 0.14 lb/10⁶ Btu | B |
| Elevated flare | NOx | 0.068 lb/10⁶ Btu | B |
| Enclosed ground flare, gas production site | THC | 332 lb/10⁶ scf burned (0.335 lb/10⁶ Btu) | Poorly representative |
AP-42 Tables 13.5-1, 13.5-2 and 13.5-3. Newer flare factors carry a representativeness grade rather than a letter rating [1].
The three flare tables publish factors for total hydrocarbons, volatile organic compounds, carbon monoxide, nitrogen oxides and soot [1]. Methane and ethane are not among them. The elevated flare THC and NOx factors come from tests burning crude propylene rather than field gas [1]. The VOC factor comes instead from studies of refinery flares burning a variety of vent gases [1]. An operator who needs a methane number cannot read one off this section at all.
Each factor is also scoped to flares performing at a stated level, and that level is not the same across the tables [1]. The elevated VOC and CO factors require at least 98 percent destruction efficiency, while the enclosed ground flare factor requires 95 percent [1]. Their datasets averaged 98.9, 99.1 and 99.33 percent respectively [1]. Those numbers describe equipment in good order.
Destruction Efficiency and Combustion Efficiency Are Different Numbers
Destruction efficiency and combustion efficiency count different things, and which one is quoted changes the number. Combustion efficiency is the fraction of hydrocarbons in the gas that a burning flare oxidises all the way to carbon dioxide [4]. Destruction efficiency is the fraction the flare destroys, whether or not those molecules were completely oxidised to carbon dioxide [4]. The gap between the two is the share that broke down without reaching carbon dioxide, leaving carbon monoxide and other hydrocarbon intermediates.
Destruction is therefore always the higher of the two figures [1]. A combustion efficiency of 96.5 percent is generally estimated to equal a destruction efficiency of 98 percent [1]. That is the pair the flare factors assume.
The 98 percent condition is stated for hydrocarbons, not for one named gas [1]. It means hydrocarbon emissions amount to less than 2 percent of the hydrocarbons in the gas stream [1]. Methane and ethane sit inside that total, yet both are excluded from the definition of volatile organic compounds [5]. So a VOC factor and a methane figure are not describing the same fraction of the same gas.
The elevated flare THC factor is measured as methane equivalent, while the enclosed ground flare THC factors are measured as propane [1]. EPA notes the elevated factor may not be appropriate for reporting VOC where a VOC factor already exists [1].
Enclosed Ground Flares Are Not Flares Under the Oil and Gas Subparts
The regulatory definition and the AP-42 organisation part company here [1]. Under 40 CFR part 60 subparts OOOO and OOOOa, and 40 CFR part 63 subparts HH and HHH, these units are not considered flares [1]. The definition of flare in those subparts specifically excludes them [1].
EPA also recommends using the AP-42 THC factor for these units instead of the VOC factor in WebFIRE [1]. The stated reasons are that background documentation exists for the newer factor and that it rests on field data from similar units [1]. EPA finalised a reconsideration on 4 April 2026 revising the temporary associated-gas flaring provisions and the continuous net heating value monitoring requirement. A broader reconsideration of the 2024 rule remains in development, so the flaring provisions are not yet settled. That uncertainty is traced in EPA’s April 2026 OOOOb/OOOOc Amendment: What Changed.
What Measurement Found Instead
A destruction efficiency assumption is a single number standing in for a range of real behaviour. The factor gives no way to express that variation, because it was derived from units that were all performing.
Several airborne studies have since measured what flares actually destroy, and they do not agree with each other [2]. The spread between the highest and lowest published figures is wider than the gap between the assumption and any single one of them.
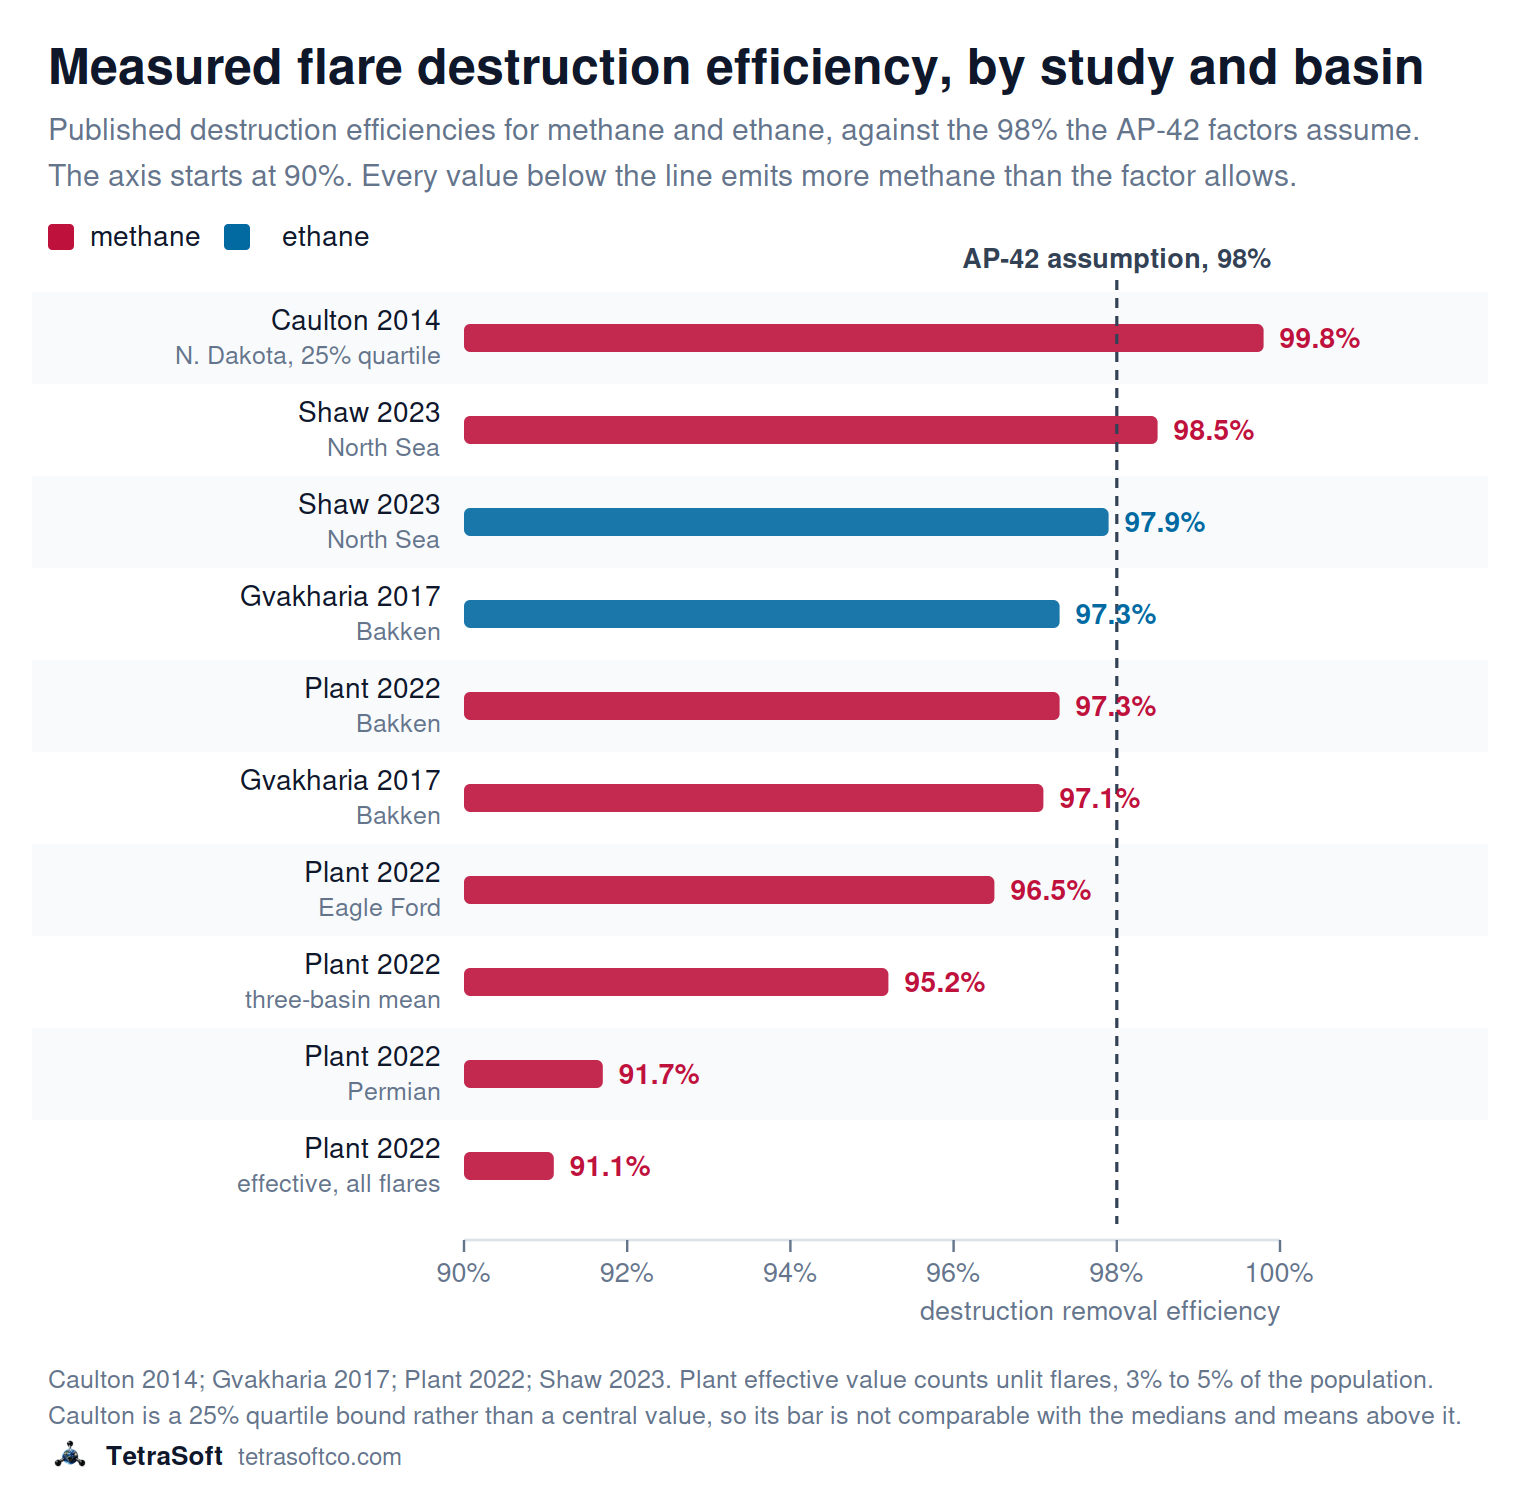
Caulton et al. reported every flare above 99.8 percent methane removal at the 25 percent quartile, the highest figures in the set [6]. Shaw et al. suggest that may reflect the targeting of larger flares, which are typically more efficient, or the limited sample size [2].
Methane and Ethane Track Each Other Closely
Methane and ethane come out close to each other wherever both were measured [2]. Shaw et al. found methane destruction marginally the greater of the two, at 98.5 against 97.9 percent [2]. Gvakharia et al. found the order reversed, at 97.1 percent for methane and 97.3 for ethane [7]. Neither difference is large beside the spread across basins.
| Study | Setting | Methane | Ethane |
|---|---|---|---|
| Caulton 2014 | 10 flares North Dakota, 1 Pennsylvania | above 99.8% at the 25% quartile | not reported |
| Shaw 2023 | North Sea, 58 plumes | 98.5% median, mean 97.9 ± 1.7 (1σ) | 97.9% median, mean 97.6 ± 1.7 (1σ) |
| Gvakharia 2017 | Bakken, 37 flares | 97.1% ± 0.4 median | 97.3% ± 0.3 median |
| Plant 2022 | Bakken | 97.3% (96.9 to 97.6, 95% CI) | not reported |
| Plant 2022 | Eagle Ford | 96.5% (95.4 to 97.4, 95% CI) | not reported |
| Plant 2022 | Permian | 91.7% (90.5 to 92.8, 95% CI) | not reported |
| Plant 2022 | three basins, burning flares | 95.2% (94.3 to 95.9, 95% CI) | not reported |
| Plant 2022 | three basins, including unlit | 91.1% (90.2 to 91.8, 95% CI) | not reported |
Plant reports means with 95 percent confidence intervals [3]. Gvakharia reports medians, with an uncertainty derived from measurement sensitivity rather than a standard interval [7]. Shaw reports a median alongside a mean carrying one sigma [2]. Caulton reports a quartile bound rather than a central value, so that row is not comparable with the others [6].
*The Plant basin rows and the 95.2 percent mean cover burning flares only, while the 91.1 percent figure also counts flares found unlit [3]. That single difference is why the effective figure sits below every basin it spans. *
Unlit Flares Drive Most of the Shortfall
Where the flare is explains more than which molecule is measured. Plant et al. measured a mean of 95.2 percent across three basins before unlit flares are counted [3]. Unlit flares, which destroy nothing at all, were between 3 and 5 percent of the population [3].
Counting them drops effective methane destruction across those basins to 91.1 percent, on a 95 percent confidence interval of 90.2 to 91.8 [3]. Those three basins are responsible for more than 80 percent of US flaring [3]. Unlit flares and inefficient combustion contribute comparably to that shortfall [3].
The authors state plainly that neither assumption, that flares stay lit and that they destroy 98 percent, rests on real-world observation [3]. They report a fivefold increase in methane emissions over present assumptions [3]. On that measured basis flaring accounts for 4 to 10 percent of total US oil and gas methane emissions [3].
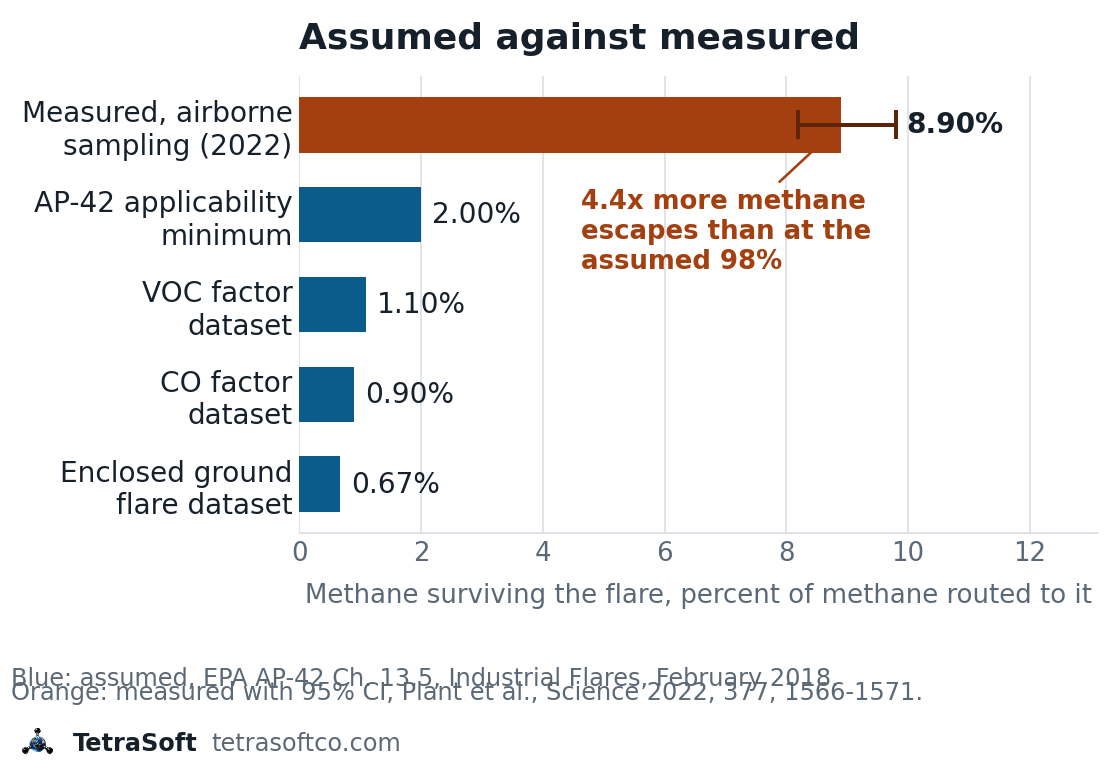
The gap is not a rounding difference between two similar numbers. A flare destroying 91.1 percent releases about four and a half times the methane of one destroying 98 percent.
Getting a Methane Number for a Real Flare
An operator reports a number for one specific flare, which is a different object from a population factor or a study average. That number has to be calculated rather than looked up, and the greenhouse gas reporting rule sets out how [4]. Equation W-19 gives the methane leaving a flare over the year [4].
| Subpart W equation | Formula |
|---|---|
| Eq. W-19, annual methane from a flare stack | Es,CH4 = Vs × XCH4 × [(1 − ηD) × ZL + ZU] |
| Symbol | Meaning | Units |
|---|---|---|
| Es,CH4 | Annual methane leaving the flare | scf/yr |
| Vs | Gas sent to the flare during the year | scf/yr |
| XCH4 | Methane mole fraction of that gas | dimensionless |
| ηD | Destruction efficiency, the hydrocarbon fraction the flare destroys | dimensionless |
| ZL | Share of the gas reaching a burning flare | dimensionless |
| ZU | Share of the gas reaching an unlit flare | dimensionless |
Volumes are at standard conditions [4]. The bracket is the fraction of methane that survives, since gas sent to an unlit flare passes through whole.
Flow comes from a continuous parameter monitoring system, and composition from a continuous analyser or from samples taken at least annually [4]. The destruction efficiency going into that equation is not a free choice, because the rule assigns it from what the operator tests and monitors [4]. Each tier is a pair of default values, one for destruction and one for combustion [4].
| Tier | What the flare must meet | Destruction | Combustion |
|---|---|---|---|
| 1 | Performance test and operating limits under 40 CFR part 63 | 98% | 96.5% |
| 2 | OOOOb monitoring, or a state plan requiring 95% methane reduction | 95% | 93.5% |
| 3 | Neither tier 1 nor tier 2 | 92% | 90.5% |
Default efficiencies for Equation W-19, from 40 CFR 98.233(n)(1) [4]. A flare that falls out of conformance for 15 consecutive days must use the tier 3 values until full conformance returns [4].
An operator may also carry a measured efficiency instead, established by performance test under the rule’s own alternative provisions [4]. The permitted efficiency therefore falls as the monitoring thins, which is the opposite of how a fixed published factor behaves. The 92 percent floor for an unmonitored flare sits close to the 91.1 percent that airborne sampling measured across three basins.
Reported Volumes Are Mostly Estimated, Not Measured
Equation W-19 starts from the volume of gas sent to the flare [4]. That volume is usually a calculation rather than a reading [8]. New Mexico’s venting and flaring filings carry a determination method on every record, which makes the split visible [8]. Across 7,730 records, 6,980 are marked estimated and 750 measured [8].
Roughly nine in ten reported entries are therefore a method output, not an instrument output. That is the single most useful thing to know before comparing a reported flare volume against anything measured independently. The same filings record roughly 9.0 million Mcf vented against 7.5 million Mcf flared [8].
An estimated volume is only as good as the method behind it. Where that method is a published factor, it carries whatever the factor’s test population contained. EPA describes most factors as averages of acceptable-quality test data standing in for a population rather than a specific facility [5].
Modelling a Flare Instead of Accepting the Tier Default
An operator without the testing and monitoring to reach tier 1 reports 92 percent, whatever the flare is actually doing. That default describes the strength of the evidence rather than the equipment. A site-specific model is how that default gets replaced with a defensible number.
A mechanistic model simulates the equipment and the process rather than multiplying an activity rate by a constant [9]. That approach is set out in a peer-reviewed 2025 study in ACS ES&T Air [9]. The Mechanistic Air Emissions Simulator is a physics-based simulator of that kind, developed at CSU and UT Austin [9]. Its output is an expected emission range rather than a single value [9].
A range is what a flare actually produces across a reporting year, because performance is not constant. It is also what makes reconciliation possible against a satellite or aerial observation. The atmospheric side of that comparison is covered in Why Satellites Show About 2x More Methane Than Inventories.
TetraSoft delivers MAES to operators through a partnership with CSU [10]. Operators weighing a modelled estimate against a tier default can see how it is delivered on the MAES platform page.
Frequently Asked Questions
What is the difference between flaring and venting?
Flaring burns the gas and venting releases it unburned [1]. Combustion converts most of the methane to carbon dioxide, so the two paths release different species [1]. In New Mexico’s 2021 to 2026 filings, venting carries more reported volume than flaring across 5,285 records against 2,445 [8]. Both are filed as waste gas disposition [8].
What net heating value does a flare need for the factors to apply?
More than 300 Btu per standard cubic foot in the vent gas, for the elevated flare factors [1]. The gas must also stay below the specified maximum flare tip velocity [1]. Those conditions come from the General Provisions of 40 CFR Part 60 [1]. The enclosed ground flare reference units met a lower threshold of 200 Btu per standard cubic foot [1]. What a wellhead stream actually measures against thresholds like that is covered in Natural Gas BTU: What Wellhead Gas Actually Measures.
Can a flare factor tell me my potential to emit?
Not for the process feeding the flare [1]. EPA states the factors are not necessarily appropriate for estimating uncontrolled emissions routed to the flare, or the potential to emit of the associated process [1]. They describe the controlled rate leaving the device [1]. Sizing an uncontrolled estimate from them inverts what they were built to represent.
Does AP-42 give a soot factor for flares?
Yes, but as a concentration range rather than a single value [1]. Elevated flares carry a soot value of 0 to 274 micrograms per litre, rated B [1]. The range is banded by visible performance, at 0 for nonsmoking flares, 40 for lightly smoking, 177 for average smoking and 274 for heavily smoking [1]. A factor keyed to how much a flare smokes is unusually honest about depending on operating condition.
What data do I need to model a flare mechanistically?
The gas stream reaching it, since composition and heating value drive combustion behaviour. The equipment configuration matters, because the flare sits downstream of separation and control decisions made elsewhere on the site. Throughput matters, since emissions respond to what moved through the facility. None of those inputs is required to apply a published factor, which is precisely why the factor cannot distinguish between two flares.
Interested in building a Measurement-Informed Inventory for your operations? Contact us to learn about our MAES-based estimation services.
References
- EPA AP-42 Chapter 13.5, Industrial Flares, February 2018. United States Environmental Protection Agency, Compilation of Air Pollutant Emission Factors. https://www.epa.gov/sites/default/files/2020-10/documents/13.5_industrial_flares.pdf
- EPA AP-42, Introduction to AP-42 Volume I, Fifth Edition, January 1995. United States Environmental Protection Agency, Compilation of Air Pollutant Emission Factors. https://www.epa.gov/sites/default/files/2020-09/documents/c00s00.pdf
- New Mexico Oil Conservation Division (OCD), monthly venting and flaring reports 2021-2026. Record counts and volumes verified 2026-07-31.
- Mollel et al., ACS ES&T Air 2025, 2, 723-735, DOI 10.1021/acsestair.4c00168. Using Prototypical Oil and Gas Sites to Model Methane Emissions in Colorado’s Denver-Julesburg Basin Using a Mechanistic Emission Estimation Tool. https://doi.org/10.1021/acsestair.4c00168
- Plant et al., Science 2022, 377, 1566-1571, DOI 10.1126/science.abq0385. Inefficient and unlit natural gas flares both emit large quantities of methane. https://doi.org/10.1126/science.abq0385
- TetraSoft, MAES Platform. https://tetrasoftco.com/maes-platform/maes-landing.html
- Gvakharia et al., Environ. Sci. Technol. 2017, 51, 5317-5325, DOI 10.1021/acs.est.6b05183. Methane, Black Carbon, and Ethane Emissions from Natural Gas Flares in the Bakken Shale, North Dakota. https://doi.org/10.1021/acs.est.6b05183
- Shaw et al., Atmos. Chem. Phys. 2023, 23, 1491-1509, DOI 10.5194/acp-23-1491-2023. Flaring efficiencies and NOx emission ratios measured for offshore oil and gas facilities in the North Sea. https://doi.org/10.5194/acp-23-1491-2023
- Caulton et al., Environ. Sci. Technol. 2014, 48, 9548-9554, DOI 10.1021/es500511w. Methane Destruction Efficiency of Natural Gas Flares Associated with Shale Formation Wells. https://doi.org/10.1021/es500511w
- 40 CFR 98.233(n), Flare stack emissions, Subpart W. United States Environmental Protection Agency, Greenhouse Gas Reporting Program, Petroleum and Natural Gas Systems, calculating GHG emissions from flare stacks. https://www.ecfr.gov/current/title-40/chapter-I/subchapter-C/part-98/subpart-W/section-98.233
This post is for informational purposes only and does not constitute legal or compliance advice. Consult qualified legal counsel or a compliance professional for guidance specific to your operations and jurisdiction.
Interactive tool
How much methane does your reported flare volume actually release?
Put in a volume you reported flared and the methane fraction of the gas. The same volume is then resolved against each published destruction efficiency, the ones the emission factors assume and the one airborne sampling measured. The gap between them is the whole subject of this post.
4.45×
more methane released at the measured efficiency than at the 98% the factors are scoped to, for the same reported volume.
| Destruction efficiency | Value | Methane released | vs 98% |
|---|---|---|---|
| AP-42 applicability minimum assumed Hydrocarbons The condition the elevated-flare factors are scoped to: well operated flares achieving at least 98% destruction efficiency. Stated for hydrocarbons in the vent gas, so it covers methane and ethane. This is the assumption the measured studies test against. | 98.00% | 17.0 Mcf | 1.00× |
| AP-42 VOC test dataset average assumed VOC, excludes methane and ethane The average destruction efficiency of the test population the VOC factor was derived from. EPA's VOC definition excludes methane and ethane as negligibly photochemically reactive, so this is not a methane figure and no methane volume is derived from it. | 98.90% | not applicable | — |
| AP-42 CO test dataset average assumed Carbon monoxide The average destruction efficiency of the test population the CO factor was derived from. CO is a product of combustion rather than a species being destroyed, so this describes the CO test population and yields no released volume of flared gas. | 99.10% | not applicable | — |
| AP-42 enclosed ground flare dataset assumed Total vent gas Average destruction efficiency on a gas volume basis for the enclosed ground flare reference units. Gas volume basis across the reference units. AP-42 gives 99.23% on a heat input basis for the same dataset. | 99.33% | 5.7 Mcf | 0.34× |
| Caulton 2014, Bakken measured Methane Airborne measurement of methane removal by flares associated with shale formation wells. The highest measured value in this set. Shaw et al. note it may reflect the targeting of larger flares, which are typically more efficient. | 99.80% | 1.7 Mcf | 0.10× |
| Shaw 2023, North Sea offshore measured Methane Offshore flares on the UK continental shelf, measured by aircraft. Median DRE for methane across 58 plumes. Mean 97.9% with a 1 sigma spread of 1.7%. | 98.50% | 12.8 Mcf | 0.75× |
| Shaw 2023, North Sea offshore measured Ethane Offshore flares on the UK continental shelf, measured by aircraft. Median DRE for ethane in the same 58 plumes. Methane destruction was marginally the greater of the two here. | 97.90% | 1.7 Mcf | — |
| Gvakharia 2017, Bakken measured Ethane Airborne sampling of 37 unique flares, with a log-normal efficiency distribution. Median DRE for ethane across 37 flare plumes, plus or minus 0.3%. Ethane was marginally the better of the two in this study. | 97.30% | 2.2 Mcf | — |
| Plant 2022, Eagle Ford measured Methane Basin-level mean from airborne sampling. Mean observed methane DRE for this basin, before the contribution of unlit flares. | 97.30% | 23.0 Mcf | 1.35× |
| Gvakharia 2017, Bakken measured Methane Airborne sampling of 37 unique flares, with a log-normal efficiency distribution. Median DRE for methane across 37 flare plumes, plus or minus 0.4%. Some individual flares fell below 85%. | 97.10% | 24.7 Mcf | 1.45× |
| Plant 2022, Bakken measured Methane Basin-level mean from airborne sampling. Mean observed methane DRE for this basin, before the contribution of unlit flares. | 96.50% | 29.8 Mcf | 1.75× |
| Plant 2022, three-basin mean observed measured Methane Mean observed methane DRE across the Bakken, Eagle Ford and Permian. Combustion performance of flares that were alight. The effective figure below is lower because it also carries flares that were not. | 95.20% | 40.8 Mcf | 2.40× |
| Plant 2022, Permian measured Methane Basin-level mean from airborne sampling. Mean observed methane DRE for this basin, and the weakest of the three before unlit flares are counted. | 91.70% | 70.5 Mcf | 4.15× |
| Plant 2022, effective, 95% CI upper measured Methane Effective methane destruction, combining combustion inefficiency with unlit flares. Upper bound of the 95% confidence interval on the effective figure. | 91.80% | 69.7 Mcf | 4.10× |
| Plant 2022, effective, all flares measured Methane The headline measured value: what the flare population actually achieved. Effective destruction across three basins responsible for more than 80% of US flaring, counting unlit flares that destroy nothing. Unlit flares were 3% to 5% of the population. | 91.10% | 75.6 Mcf | 4.45× |
| Plant 2022, effective, 95% CI lower measured Methane Effective methane destruction, combining combustion inefficiency with unlit flares. Lower bound of the 95% confidence interval on the effective figure. | 90.20% | 83.3 Mcf | 4.90× |
At the measured efficiency that is 3,198 lb of methane. Mass uses 16.043 lb/lbmol over 379.5 scf/lbmol at 60 degrees F and 14.696 psia. Volume results do not depend on it.
The ratio above is combustion efficiency alone. The study it comes from reports a fivefold increase in methane emissions over present assumptions, a larger figure because it also carries flares that were unlit and destroyed nothing. Flaring on that measured basis accounts for 4 to 10% of total US oil and gas methane emissions.
Assumed efficiencies: EPA AP-42 Chapter 13.5, Industrial Flares, February 2018. Measured efficiency: Plant et al., Science 2022, 377, 1566-1571, DOI 10.1126/science.abq0385.
Comments
0Share your thoughts. All comments are moderated before appearing.
No comments yet. Be the first to share your thoughts!