Stack testing is the direct measurement of pollutant concentration and gas flow at the exhaust point of a source [1]. EPA calls the exercise a performance test, and it runs only under conditions the reviewing agency accepts as representative [1]. The procedures live in the reference methods published at 40 CFR Part 60 Appendix A, with one method for each quantity measured [2]. A crew measures velocity, moisture, molecular weight, and pollutant concentration, then combines them into a single mass emission rate [2]. The result is the strongest evidence you can get about that outlet on the day of the test. It says nothing about the other 360-odd days.
Quick Answer: A stack test is a performance test measuring pollutant concentration and volumetric flow at a source outlet, using EPA reference methods [1]. Each test consists of three separate runs, and compliance uses the arithmetic mean of the three [1]. The rule excludes startup, shutdown, and malfunction from what counts as representative conditions [1].
A Stack Test Combines Four Separate Measurements
No single instrument produces an emission rate, so a test stacks several methods on top of each other. Method 1 sets the sample and velocity traverse points, which fixes where in the duct the crew samples [2]. Method 2 determines stack gas velocity and volumetric flow rate using a Type S pitot tube [2].
A raw velocity is not yet a flow, so two more methods supply the corrections. Method 3 is the gas analysis for determining dry molecular weight [3]. Method 4 determines moisture content in stack gases [4].
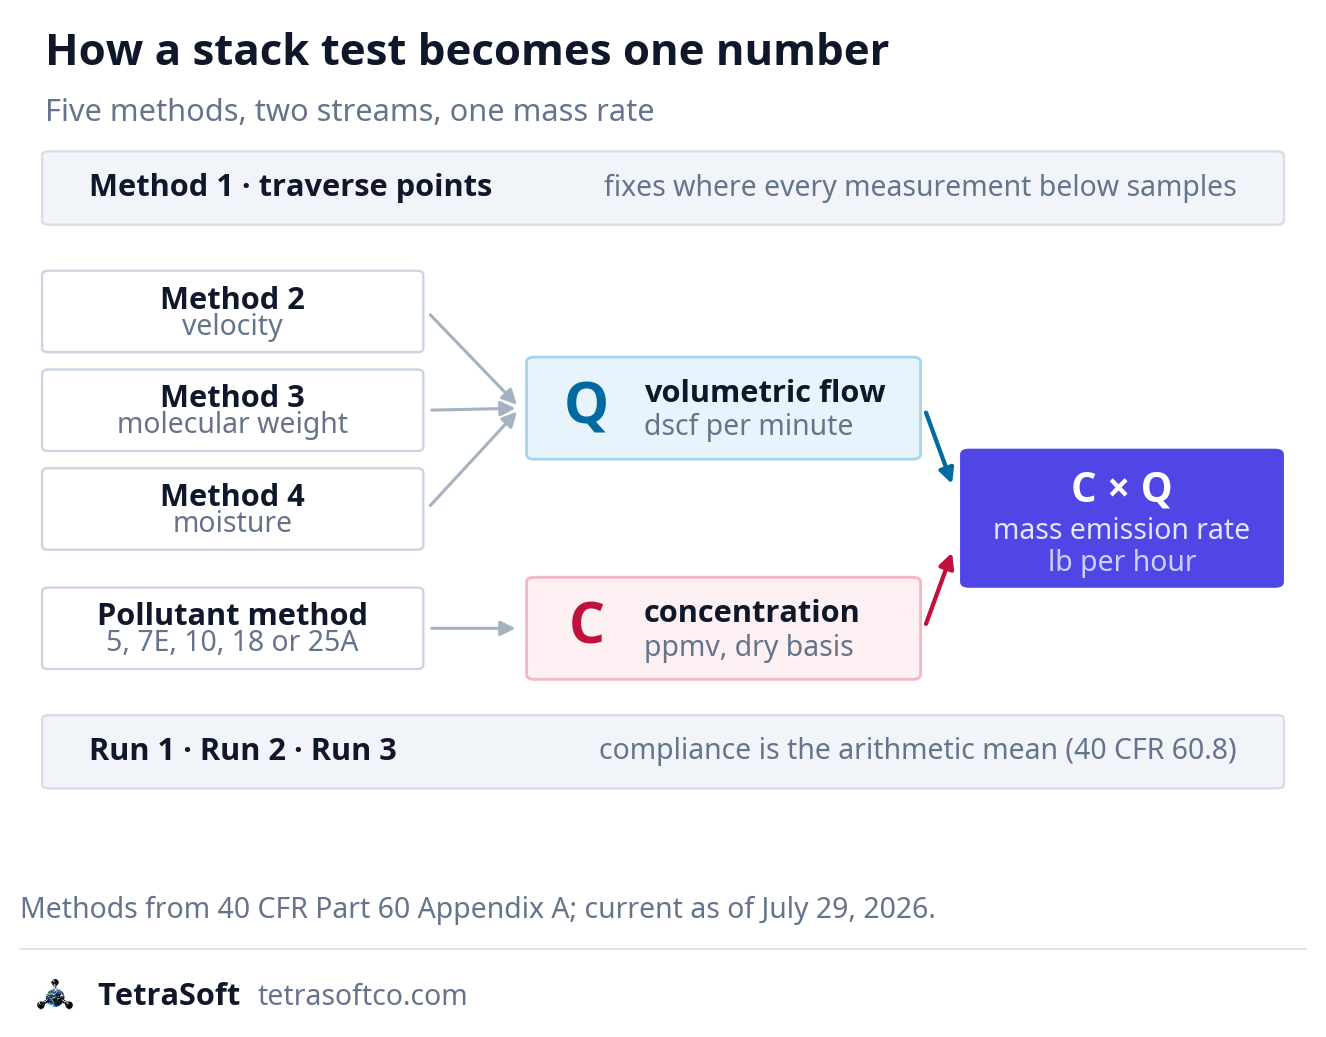
Four reference methods and a pollutant method combine into one mass emission rate, and compliance is the arithmetic mean of three such runs. [1]
The Pollutant Method Depends on the Pollutant
Concentration comes from a separate method chosen for the analyte. Method 7E determines nitrogen oxides emissions by instrumental analyzer procedure [5]. Method 10 determines carbon monoxide emissions from stationary sources [5]. Method 25A determines total gaseous organic concentration using a flame ionization analyzer [6].
For methane and ethane, the total is not enough. Method 18 measures gaseous organic compound emissions by gas chromatography, which is how individual hydrocarbons such as methane and ethane get their own numbers [7]. Method 3C determines carbon dioxide, methane, nitrogen, and oxygen from stationary sources [3]. One method reads the organic total, and two others put names on the molecules.
Particulate matter has a method of its own. Method 5 determines particulate matter emissions from stationary sources [4]. Four methods build the flow, and one more is chosen for the pollutant being measured.
| Method | What it determines | Role in the rate |
|---|---|---|
| Method 1 | Sample and velocity traverse points | Fixes where in the duct every other measurement is taken |
| Method 2 | Stack gas velocity and volumetric flow rate, by Type S pitot tube | Flow |
| Method 3 | Dry molecular weight, by gas analysis | Flow: corrects the velocity |
| Method 4 | Moisture content in stack gases | Flow: corrects the velocity |
| Method 5 | Particulate matter emissions | Concentration: filterable PM |
| Method 7E | Nitrogen oxides, by instrumental analyzer | Concentration: NOx |
| Method 10 | Carbon monoxide emissions | Concentration: CO |
| Method 18 | Individual gaseous organics, by gas chromatography | Concentration: speciated hydrocarbons such as methane and ethane |
| Method 25A | Total gaseous organic concentration, by flame ionization analyzer | Concentration: total hydrocarbons |
| Method 3C | Carbon dioxide, methane, nitrogen, and oxygen | Concentration: methane among the fixed gases |
*Each method name links to its appendix of 40 CFR Part 60 Appendix A. *
The calculator below runs that combination for your own numbers, three runs to a mean.
What the Operator Has to Supply
Testing obligations reach the facility itself, not just the crew. Ports sized for the chosen methods, a safe platform, safe access to it, and power for the equipment all fall to the operator [1]. The duct also has to be clear of cyclonic flow while testing, which the crew demonstrates using the applicable methods [1].
Timing is fixed by rule rather than by convenience. Performance tests happen within 60 days after the facility reaches its maximum production rate, and not later than 180 days after initial startup [1]. The operator gives at least 30 days prior notice so the Administrator can observe [1].
A Stack Test Result Describes Normal Operation Only
The rule that requires the test also narrows what the test is allowed to see. The agency sets the operating conditions for the test, anchored to how the unit performs representatively [1]. Startup, shutdown, and malfunction periods are carved out, and none of them counts as representative for a performance test [1].
That exclusion is deliberate and reasonable, since a compliance test should not judge a unit on a bad morning. It also means the measurement and the annual inventory are answering different questions.
The Same Boundary Applies to Emission Factors
Published factors carry the identical limitation, stated in the same plain terms. EPA writes that source-specific tests or continuous monitors determine a source’s actual contribution better than emission factors can [8]. Even then, the results apply only to the conditions existing at the time of the testing or monitoring [8]. What the factors themselves assume is walked in AP-42 Emission Factors by Source Type, and What They Assume.
Two independent documents drew the same boundary without coordinating. Neither method claims to represent abnormal operation, and neither is wrong to decline.
Reconciliation Turns a Stack Test Into Inventory Evidence
A stack test and an inventory disagree for structural reasons, not because one of them is faulty. The test covers one outlet across three runs [1]. The inventory covers every source at the site across a full year, including intermittent and abnormal events.
Reconciling the two is now an explicit reporting requirement rather than an academic exercise [9]. OGMP 2.0 Level 5 requires measuring the whole site, then reconciling that against the source-level estimate statistically and reporting the uncertainty that survives [9].
A Stack Test Is the Level 5 Problem in Miniature
The gap between a measured number and a built-up estimate is the same gap at both scales. At one outlet, the reconciliation is tractable, because the measured stream and the estimated stream describe the same pipe. Across a whole site, the measurement captures sources the estimate may have missed entirely, and the attribution is no longer obvious.
Closing that gap needs an estimate that can represent conditions no test observed. A mechanistic model simulates the equipment and the process rather than multiplying an activity by a constant [10]. The Mechanistic Air Emissions Simulator is a physics-based simulator of that kind, with its methodology developed at CSU-METEC [11]. It generates an expected emission range rather than a single value, which is the form a reconciliation can actually use [11]. TetraSoft’s founders built MAES as research scientists at CSU-METEC, and the platform offers commercial access to that published methodology [11].
For the satellite view of the same reconciliation problem, see Why Satellites Show About 2x More Methane Than Inventories. For a single equipment class where the modeled and assumed values diverge sharply, see Glycol Pumps: 90% of Uncontrolled TEG Dehydrator Emissions.
Frequently Asked Questions
How many runs does a stack test require?
A performance test is three separate runs of the applicable method, unless the governing subpart says otherwise [1]. Compliance is determined from the arithmetic mean of the three runs [1]. A sample may be lost, or a run discontinued for reasons beyond the operator’s control [1]. The Administrator may then approve using the mean of the other two runs [1]. Each run lasts for the time and under the conditions the applicable standard specifies [1].
Can an operator use a method other than the reference method?
Yes, with agency approval, and the rule lists the specific routes [1]. The Administrator may specify or approve a reference method with minor changes in methodology [1]. Approving an equivalent method, or an alternative method adequate for indicating compliance, is also allowed [1]. The Administrator may also approve shorter sampling times and smaller sample volumes when process variables require it [1]. None of that removes EPA’s separate authority to require testing under section 114 of the Act [1].
What happens if a scheduled stack test has to be moved?
Rescheduling runs on notice, and the rule gives two ways to do it [1]. The operator can provide at least 7 days notice of the new date [1]. Alternatively, the operator can arrange a rescheduled date with the agency by mutual agreement [1]. That shorter window contrasts with the 30 days required ahead of the original date.
What happens if a test has to be delayed by an event outside the operator’s control?
The rule provides a force majeure route, and it runs on notice rather than on discretion alone [1]. The operator notifies the Administrator in writing as soon as practicable, and generally before the test deadline [1]. The notice describes the event, the rationale for the delay, the measures taken to minimize it, and a proposed test date [1]. Until an extension is approved, the facility remains strictly subject to the requirements of the part [1].
Which assets does OGMP 2.0 Level 5 actually apply to?
Level 5 applies to an operator’s material assets rather than to every facility it runs [12]. Material assets are those accounting for 95 per cent of an operator’s total emissions [12]. The deadline is three years for operated assets and five for non-operated assets [13]. Reporting all material assets at Level 4 and Level 5 is what earns Gold Standard Reporting [13].
Interested in building a Measurement-Informed Inventory for your operations? Contact us to learn about our MAES-based estimation services.
References
- 40 CFR 60.8, Performance tests, current as of July 29, 2026. Electronic Code of Federal Regulations, Title 40, Part 60, Subpart A. https://www.ecfr.gov/current/title-40/chapter-I/subchapter-C/part-60/subpart-A/section-60.8
- 40 CFR Part 60 Appendix A-1, Test Methods 1 through 2F, current as of July 29, 2026. Electronic Code of Federal Regulations. https://www.ecfr.gov/current/title-40/chapter-I/subchapter-C/part-60/appendix-Appendix%20A-1%20to%20Part%2060
- 40 CFR Part 60 Appendix A-2, Test Methods 2G through 3C, current as of July 29, 2026. Electronic Code of Federal Regulations. https://www.ecfr.gov/current/title-40/chapter-I/subchapter-C/part-60/appendix-Appendix%20A-2%20to%20Part%2060
- 40 CFR Part 60 Appendix A-3, Test Methods 4 through 5I, current as of July 29, 2026. Electronic Code of Federal Regulations. https://www.ecfr.gov/current/title-40/chapter-I/subchapter-C/part-60/appendix-Appendix%20A-3%20to%20Part%2060
- 40 CFR Part 60 Appendix A-4, Test Methods 6 through 10B, current as of July 29, 2026. Electronic Code of Federal Regulations. https://www.ecfr.gov/current/title-40/chapter-I/subchapter-C/part-60/appendix-Appendix%20A-4%20to%20Part%2060
- 40 CFR Part 60 Appendix A-7, Test Methods 19 through 25E, current as of July 29, 2026. Electronic Code of Federal Regulations. https://www.ecfr.gov/current/title-40/chapter-I/subchapter-C/part-60/appendix-Appendix%20A-7%20to%20Part%2060
- 40 CFR Part 60 Appendix A-6, Test Methods 16 through 18, current as of August 26, 2026. Electronic Code of Federal Regulations. https://www.ecfr.gov/current/title-40/chapter-I/subchapter-C/part-60/appendix-Appendix%20A-6%20to%20Part%2060
- EPA AP-42, Introduction to AP-42 Volume I, Fifth Edition, January 1995. United States Environmental Protection Agency, Compilation of Air Pollutant Emission Factors. https://www.epa.gov/sites/default/files/2020-09/documents/c00s00.pdf
- UNEP OGMP 2.0 Module 2, The OGMP 2.0 reporting levels, August 2025. https://www.ogmpartnership.org/sites/default/files/resources/2025-08/OGMP%20module%20-%202.pdf
- UNEP OGMP 2.0 Module 1, Introduction to OGMP 2.0 reporting and mitigation framework, August 2025. https://www.ogmpartnership.org/sites/default/files/resources/2025-08/OGMP%20module%20-%201.pdf
- UNEP OGMP 2.0, OGMP 2.0 Level 5 Assessment, March 2026. https://www.ogmpartnership.org/sites/default/files/resources/2026-03/OGMP%202.0%20Level%205%20Assessment.pdf
- Mollel et al., ACS ES&T Air 2025, 2, 723-735, DOI 10.1021/acsestair.4c00168. Using Prototypical Oil and Gas Sites to Model Methane Emissions in Colorado’s Denver-Julesburg Basin Using a Mechanistic Emission Estimation Tool. https://doi.org/10.1021/acsestair.4c00168
- TetraSoft, MAES Platform. https://tetrasoftco.com/maes-platform/maes-landing.html
This post is for informational purposes only and does not constitute legal or compliance advice. Consult qualified legal counsel or a compliance professional for guidance specific to your operations and jurisdiction.
Interactive tool
Stack test emission rate calculator
A test report states a concentration; a permit limit is usually a mass rate. Enter the three run concentrations and the dry standard flow, and read each run's rate and the mean the rule compares against the limit.
Three-run arithmetic mean
3.64 lb/hr
Arithmetic mean of three runs, the figure 60.8 compares against the limit.
| Run | Concentration | Mass rate (lb/hr) |
|---|---|---|
| Run 1 | 42 ppmvd | 3.61 lb/hr |
| Run 2 | 45 ppmvd | 3.87 lb/hr |
| Run 3 | 40 ppmvd | 3.44 lb/hr |
lb/hr = ppmvd × 10−6 × MW × dscfm × 60 ÷ 385.3, the molar volume at the 40 CFR 60.2 standard conditions (20°C, 101.3 kPa). Three runs and the arithmetic mean per 40 CFR 60.8. kg/hr and g/s convert at 0.45359237 kg per lb, exact by definition. No diluent correction is applied. A starting point, not a test report. Nothing leaves your browser.
Comments
0Share your thoughts. All comments are moderated before appearing.
No comments yet. Be the first to share your thoughts!