In 2017, the International Energy Agency estimated that wider use of existing digital technologies could cut oil and gas production costs by 10% to 20% [1]. Published studies now apply artificial intelligence across the industry, from reading seismic surveys to spotting methane leaks from space. The gains come from specific, measurable uses, and in the three cases below a key limit comes from the record the model depends on.
AI in oil and gas is broader than one technique. The OECD defines an AI system as a machine-based system that, for explicit or implicit objectives, infers from its input how to generate outputs [2]. Its examples of outputs are “predictions, content, recommendations, or decisions that can influence physical or virtual environments.” [2] In oil and gas that covers machine learning on sensor data, computer vision on seismic and satellite images, and physics-informed models.
The term also covers optimisation, and generative AI that reads well documents. This guide is for oil and gas data teams and the engineers who supply their well and sensor data. The guide covers where AI is used, three uses that depend on a documented record, and the checks to run on your own well data.
Quick Answer: AI in oil and gas already reads seismic faults, speeds drilling, forecasts production, predicts pump failures, detects methane plumes and finds lost wells. Published gains are real, but pump-failure, methane-plume and lost-well results each depend on the record the model learns from or is checked against. A duplicated well list, a stale facility list or an unlogged failure turns an accurate model into a wrong answer. Check that record before you buy or build the model.
AI Is Already Used From Exploration to Production
AI has published, measured results from exploration through drilling, production and pipelines to records management. Six of the ten rows are upstream, meaning exploration and production, the segment Koroteev and Tekic call “the most capital-intensive part of oil and gas.” [3]
| Area | Use | Published result |
|---|---|---|
| Exploration | Fault detection in 3D seismic | A network trained on synthetic data found faults “much more accurately and efficiently than conventional methods” (Wu et al. 2019) |
| Drilling | Rate-of-penetration advice | Rate of penetration rose from 10.4 to 31 m/h over a 136 m interval in one test well (Al-Riyami et al. 2023) |
| Drilling | Geosteering | Lithology predicted with over 80% accuracy in test wells (Gupta et al. 2020) |
| Reservoir | Production forecasting | Authors concluded machine learning fits the SEC’s reliable-technology definition, after testing it on 136 Bakken wells (Fulford et al. 2016) |
| Production | Rod-pump diagnosis | Over 90% accuracy in an on-site run, trained on a year of data from over 300 wells (Wang et al. 2021) |
| Production | Submersible pump lifespan | Up to 20.3% more cumulative production than single-objective optimisation, in a one-year, 30-well field validation (Liang et al. 2026) |
| Emissions | Methane plumes from satellites | 2,974 plumes detected worldwide in 2021 (Schuit et al. 2023) |
| Midstream | Pipeline corrosion risk | 94% accuracy classifying corrosion defects as high, medium or low risk (Sani et al. 2025) |
| Records | Reading well documents with language models | 100% accuracy on clean PDFs, 70% on scanned image records (Ma et al. 2024) |
| Land | Lost wells on historical maps | 1,301 candidates flagged in four counties (Ciulla et al. 2024) |
One peer-reviewed or conference result per use; each figure is the study’s own, on its own data.
Three Uses Can Each Be Checked Against a Record
Pump failure prediction, methane plume detection and lost-well searches get a close look because each is checked against a documented record. Together they cover the three places that record lives. Pump models rely on operators’ private failure logs; plume and well searches rely on public facility and well lists.
Seismic, drilling and reservoir models matter as much, but operators hold much of their survey and well data, though some studies use public Volve data. The three chosen uses are the ones a data team can test with public records.
What Limits AI in Oil and Gas
Physics is the first limit. Pure data-driven models can “lack interpretability” and have “limited domain-specific knowledge,” which is why physics-informed models build in governing physical laws [4]. SEC reserves rules define reliable technology as one field tested and shown to give “reasonably certain results with consistency and repeatability.” [5]
Data is the second. Scanned records are harder: one language-model workflow read 150 clean PDF reports perfectly but located 7 of 10 scanned records correctly [6]. The three cases below show where each record breaks.
Three Uses Show That the Record Decides the Result
All three models worked. What decided their value was the record behind them and the decision they fed.
Sensor Data Can Predict Pump Failures Before They Happen
Sensor data can warn that a well’s pump is heading for failure before the well stops. Wells without enough reservoir pressure to push fluid to surface rely on artificial lift, equipment that raises the fluid. The electrical submersible pump (ESP), set deep in the well, is one form.
The ESP “has been applied to about 20 percent of almost one million wells worldwide.” [7] When one fails, the well stops producing until a crew pulls and replaces it.
Guo and colleagues trained a support vector machine, a classic machine learning classifier, on pump electrical and frequency data to predict failures before they occur [7]. A 2026 study went further, predicting each pump’s remaining life and using it to set operating targets [8]. In a one-year field test on 30 pump wells, it gave up to 20.3% more cumulative production than single-objective optimisation [8].
The lesson: value came when the prediction changed a decision, not when the model was accurate. Both models learned from field records of pump operation and failure, so a failure missing from those records is one the model cannot learn. For AI in oil and gas generally, the operational record is the fuel, and its gaps become the model’s blind spots.
AI Finds Methane Plumes and Lost Wells, but People Confirm Them
AI can spot methane plumes in satellite data and well symbols on old maps, but people still confirm each detection. Schuit and colleagues built a two-step machine learning system that finds methane super-emitters, sites releasing methane at unusually high rates, in TROPOMI satellite data [9]. “We detect 2974 plumes in 2021,” they report, about eight a day [9]. Using emission inventories, they attributed 24% of the plumes to gas infrastructure and 21% to oil infrastructure [9].
Ciulla and colleagues trained U-Net, an image-recognition neural network, to find well symbols on USGS topographic maps printed between 1947 and 1992 [10]. They were hunting undocumented orphaned wells, “wells without an operator that have limited or no documentation with regulatory authorities.” [10] For a detailed breakdown of how documented orphan wells are listed today, see: Abandoned Gas Wells: What They Are and Where to Find Them.
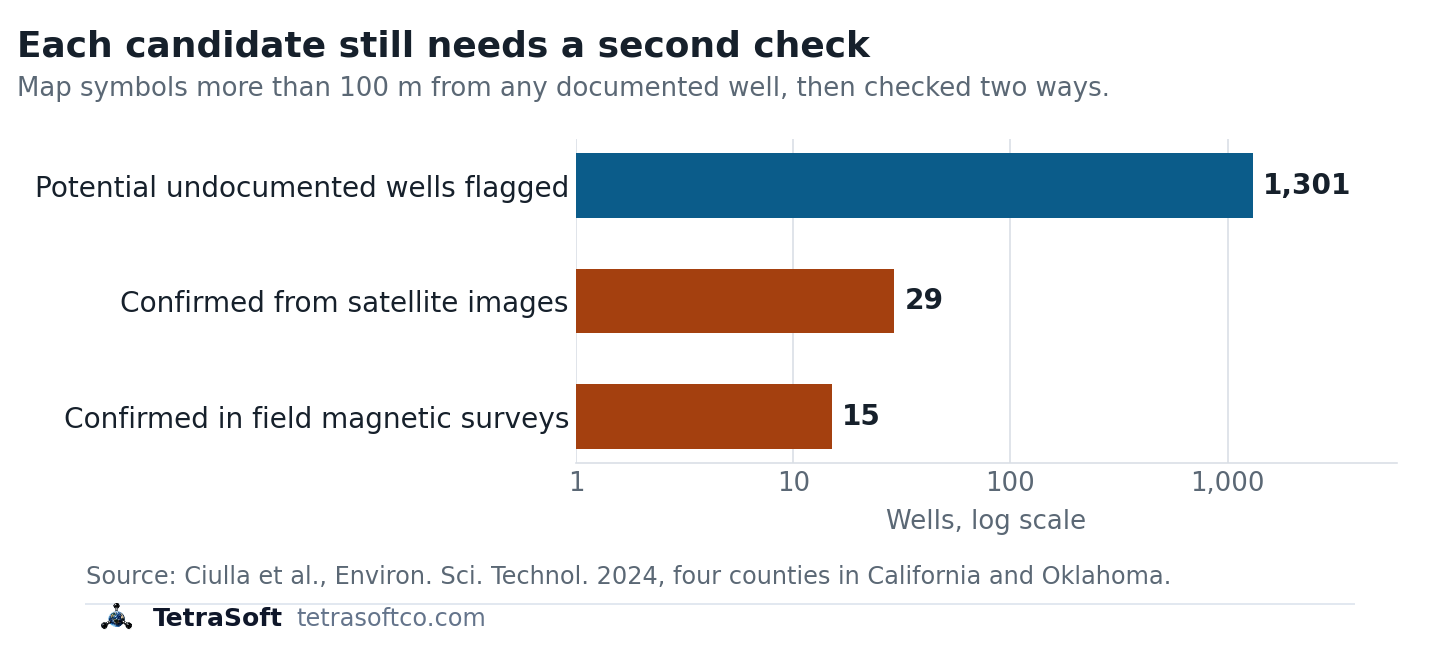
Across four counties the model flagged 1,301 candidates; checks confirmed 29 from satellite images and 15 with field magnetic surveys. [10]
The model’s precision, the share of its detections that were real well symbols, was 0.98 on its test set [10]. Yet only 30% to 98% of flagged map symbols survived a visual check that they were real well symbols, depending on the study area [10]. Some candidates “may actually be documented wells because of location errors in the official databases or topographic maps.” [10]
The lesson: both studies still needed people to verify each detection and to check it against inventories or well records. A model right 98 times in 100 can fill its candidate list with errors, because its few false detections mostly land far from documented wells.
Why AI Projects Break on the Record, and How to Check Yours
Each of the three uses depends on a documented record, and each breaks on a different defect in it. The figure pairs each use with the record it needs and the defect that turns into a wrong answer.
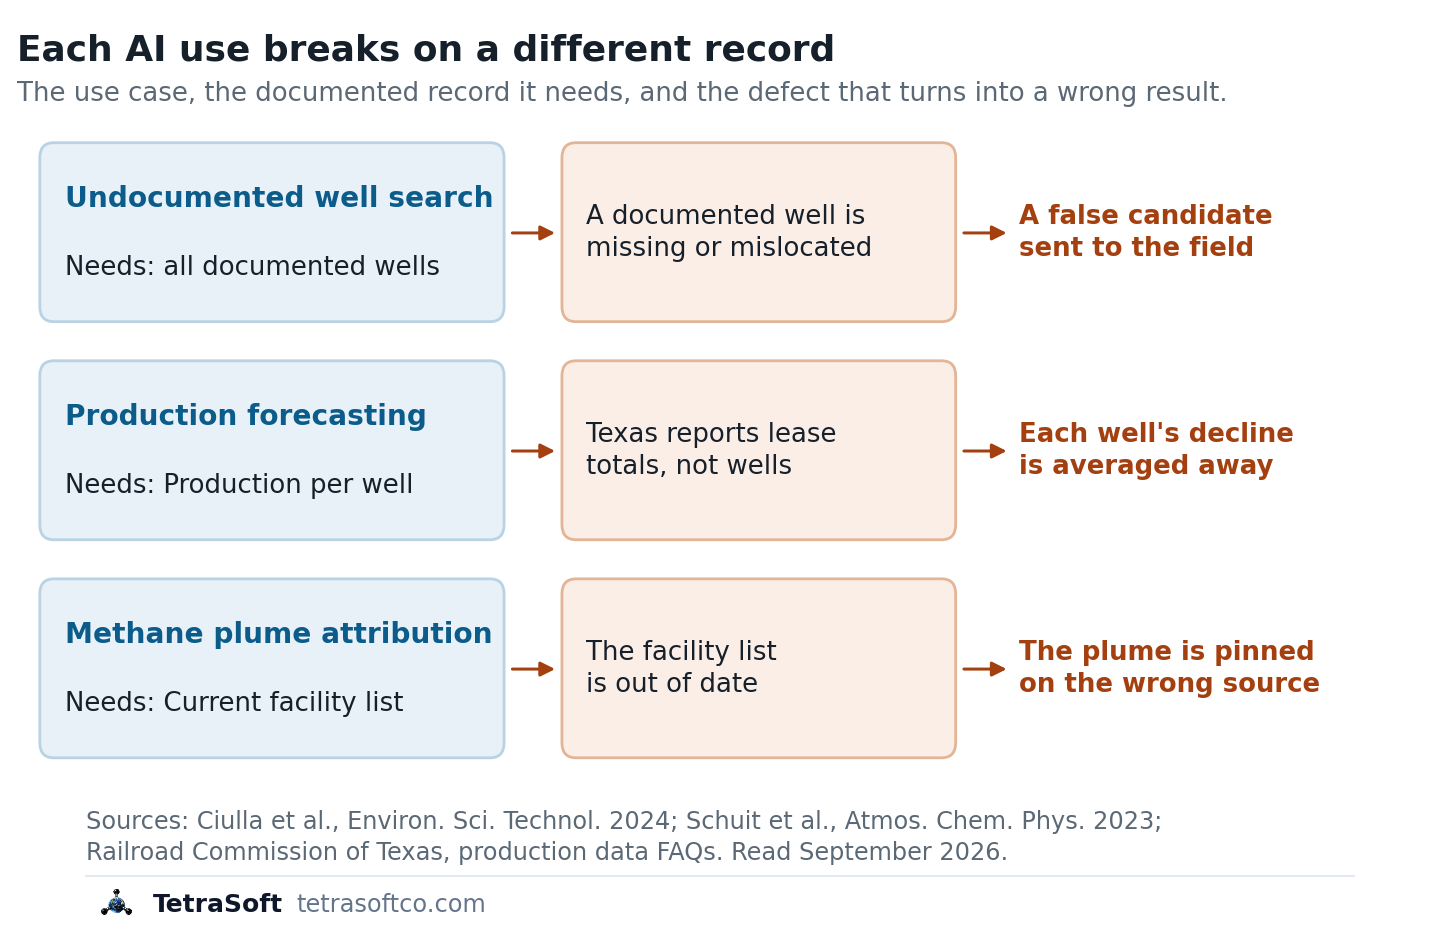
One defect per use: the undocumented-well search needs all documented wells, whatever their status; a missing or mislocated well becomes a false candidate.
Lease Totals and Stale Lists Break Forecasts and Attribution
A production forecast needs production counted per well, and state records often report something else. Texas, the largest producing state, is the clearest example. There, “production is reported by each oil and gas lease rather than individual well.” [11]
An oil lease’s monthly report “includes production from all of the wells on the lease,” so one number covers many wells [11]. Any per-well figure is therefore an allocation. TetraSoft Atlas, our subscription platform for public well records, splits each lease total evenly across the lease’s wells, matched by each well’s API number [12]. A forecast trained on allocated figures learns the allocation, and a strong well sharing a lease with weak ones looks average.
API Well Number Lookup: What It Is and How to Read One explains how to read that number.
Plume attribution breaks on a stale facility list instead, but how far it can go depends on the instrument. Satellite point-source imagers have pixels under 60 metres, so they place a plume on a site [13]. Matching it to an operator then needs a current facility list.
Aircraft lidar detects far smaller leaks: one system averaged a 90% probability of detecting 1.27 kilograms an hour in 2023 production-site scans [14]. Its detected sources can be localized within 2 metres and attributed to specific equipment, so attribution goes below the facility [15].
| AI use | Input data | Record the result depends on | Defect to test |
|---|---|---|---|
| Pump failure prediction | Pump electrical and frequency data | Failure and maintenance logs, held privately | Failures missing from the logs |
| Undocumented well search | Historical topographic maps | All documented wells, any status, with coordinates | Missing or mislocated wells |
| Area-flux methane mapping | Coarse satellite methane data | Regional emission inventories | Point sources missing from the inventory |
| Point-source methane imaging | Fine-resolution satellite or aircraft images | Current facility and operator list; equipment list for aircraft lidar | Facilities missing from the list |
| Production forecasting | Monthly production | Production measured per well | Lease totals split across wells, broken joins, short history |
The table extends the three worked cases to five uses, adding production forecasting and splitting methane detection by instrument; the checker below runs each test.
TetraSoft Atlas Supplies the Well List an AI Search Checks Against
An undocumented-well search is only as good as the documented-well list it measures against. TetraSoft Atlas, our subscription platform that reconciles state well records into one dated record, supplies that list for eight states. The eight states hold about 2.8 million well records, and we plan to expand Atlas to every US state [16].
Texas, New Mexico, Oklahoma, Colorado, Wyoming, Pennsylvania, West Virginia and Ohio produced 68 percent of US crude, and 83 percent of marketed gas, in 2025 [17]. The Oklahoma list in Atlas holds about 456,000 records, about 250,000 of them plugged wells, a status a list of active wells would drop [18]. The Atlas landing page states that “Every fact is traceable to its source agency.” [19] That matters when each false candidate costs a satellite check or a field visit.
A detected plume raises the next question: was that release abnormal for the site? MAES does not model an orphaned well, so it plays no part in the lost-well search. For a producing site, a detection can be judged against the expected emission range that MAES, the Mechanistic Air Emissions Simulator, models. MAES was developed through research that includes the EEMDL initiative of CSU and UT Austin, and TetraSoft uses it through a partnership with CSU [20].
Checking a documented-well list takes minutes when it is already joined. Run the checks on eight states of well records during a seven-day trial, with no credit card required.
Frequently Asked Questions
How are oil and gas workers using AI in their jobs?
Mostly on everyday data rather than new science. In a discussion with EY, an operator’s manager cites generative AI “automating natural language search and summary, for items such as daily well-work reports.” [21] The same manager lists “analyzing images of equipment to assist with failure diagnosis” and invoice coding for field work [21]. The manager said the majority of generative AI use cases in the company’s trial came from production engineering, “for example, surveillance and artificial lift.” [21]
Will AI replace oil and gas jobs?
The published analyses describe AI raising productivity rather than replacing field roles. BCG says oil and gas companies automating simple tasks could “immediately boost productivity by 10% to 15%.” [22] In the published plume and lost-well studies, people still check the model’s output, and some detections go on to targeted satellite imaging or field surveys.
Can AI find orphan wells?
Yes, AI can flag likely orphan wells, but people still have to confirm each one. The Interior Department’s FY2025 orphaned wells report cites an Interstate Oil and Gas Compact Commission estimate of 250,000 to 740,000 undocumented orphaned wells nationwide [23]. Confirmation still needs a second check: in the study, satellite images confirmed 29 candidates and field magnetic surveys confirmed 15 [10].
How accurate is AI at finding undocumented wells?
On the study’s validation set, used to tune the model, it found 88% of the well symbols present, a measure called recall [10]. Symbol accuracy is not candidate accuracy, because a correctly read symbol can still be a documented well whose record is missing or mislocated. Judge a tool by how many of its candidates survive vetting, not by its detection score.
What data do you need to train an oil and gas AI model?
Supervised models, such as published pump-failure and lost-well models, need labelled examples to learn from and a documented record to check output against. Public state records cover wells, locations, statuses, permits and production. Pump sensor data and failure logs stay with the operator, so predictive maintenance models are built on private data.
This post is for informational purposes only and does not constitute legal or compliance advice. Consult qualified legal counsel or a compliance professional for guidance specific to your operations and jurisdiction.
References
- IEA, Digitalization and Energy, 2017
- OECD, Recommendation of the Council on Artificial Intelligence, AI system definition, November 2023
- Koroteev and Tekic, Energy and AI, 2021, doi:10.1016/j.egyai.2020.100041
- Latrach et al., Geoenergy Science and Engineering, 2024, doi:10.1016/j.geoen.2024.212938
- 17 CFR 210.4-10(a)(25), reliable technology
- Ma et al., Scientific Reports, 2024, doi:10.1038/s41598-024-81846-5
- Guo et al., SPE Western Regional Meeting, 2015, doi:10.2118/174062-MS
- Liang et al., SPE Journal, 2026, doi:10.2118/221041-PA
- Schuit et al., Atmospheric Chemistry and Physics, 2023, doi:10.5194/acp-23-9071-2023
- Ciulla et al., Environmental Science & Technology, 2024, doi:10.1021/acs.est.4c04413
- Railroad Commission of Texas, Production Data Query System FAQs. https://www.rrc.texas.gov/about-us/faqs/oil-gas-faq/production-data-query-system-faqs/
- TetraSoft Atlas, Texas production grain, lease total divided by wells on the lease. https://www.tetrasoftco.com/atlas-landing.html
- Jacob et al., Atmospheric Chemistry and Physics, 2022, 22, 9617-9646, DOI 10.5194/acp-22-9617-2022
- Thorpe et al., Remote Sensing of Environment, 2024, doi:10.1016/j.rse.2024.114435
- TetraSoft Atlas, per-state well counts read September 2026
- U.S. Energy Information Administration, crude oil and natural gas marketed production by state, annual 2025, accessed September 23, 2026
- TetraSoft Atlas and Oklahoma Corporation Commission RBDMS well data, read September 29, 2026
- TetraSoft Atlas landing page, tetrasoftco.com/atlas-landing.html
- TetraSoft, MAES Platform product page, accessed September 23, 2026
- López and Ruiz-Cabrero, BCG, The AI-First Oil and Gas Company, 2025. https://www.bcg.com/publications/2025/ai-first-future-of-oil-and-gas-companies
- Wu et al., Geophysics, 2019, doi:10.1190/geo2018-0646.1
- Al-Riyami et al., SPE/IADC Middle East Drilling Technology Conference and Exhibition, 2023, SPE-214521-MS, doi:10.2118/214521-MS
- Gupta et al., SPE Journal, 2020, doi:10.2118/199882-PA
- Fulford et al., SPE Economics & Management, 2016, doi:10.2118/174784-PA
- Wang et al., SPE Production & Operations, 2021, doi:10.2118/205015-PA
- Sani et al., Journal of Pipeline Science and Engineering, 2025, doi:10.1016/j.jpse.2024.100244
- EY, AI in oil and gas, industry discussion, September 9, 2025. https://www.ey.com/en_us/energy-resources/ai-in-oil-and-gas
- U.S. Department of the Interior, Orphaned Wells Program Annual Report to Congress, FY2025
- Donahue et al., Environmental Science & Technology, 2026, 60(19), 13968, DOI 10.1021/acs.est.5c15184
Interactive tool
Is your well data ready for AI?
Pick the AI use case and describe the well data you would train or check it on. It runs only the checks that can break that use case and lists what to fix, in the order to fix it.
Verdict
Fix one gap first
0 of 1 checks pass
- Results are checked against the documented well list, every status, with coordinates.
- Include every documented well, plugged ones too: a well missing from the list turns into a false candidate.
Checks follow Ciulla et al. 2024 and Schuit et al. 2023; freshness and history thresholds are our rules of thumb, set from the cadence the records are published on, not published standards. It checks your data, not a model, and it does not replace a data audit.
Comments
0Share your thoughts. All comments are moderated before appearing.
No comments yet. Be the first to share your thoughts!