The Permian Basin covers West Texas and southeastern New Mexico, and it produced more crude oil in 2024 than any other US region [1]. On the Texas side, wells answer to the Railroad Commission of Texas, which keeps its own census, production files and operator names [2]. Across the state line, the New Mexico Oil Conservation Division keeps a separate register with different identifiers and a different status vocabulary [3].
A basin-wide count therefore depends on which side you ask and in which format, which is why published Permian totals rarely agree. All 389,187 sit on one map in TetraSoft Atlas, our subscription platform joining well, production and operator records across eight states [2].
Quick Answer: The Permian Basin holds 389,187 oil and gas wells on record, 289,563 in the three Texas Railroad Commission districts that cover it and 99,624 across New Mexico’s four Permian counties. The region averaged 6.3 million barrels per day in 2024, 48% of total US crude output [1]. TetraSoft Atlas puts both registers on one map: open any Permian well for its operator, monthly production back to 1993, inspection and completion history, gatherers and gas analysis, without querying two agencies. Counts are wells on record, which includes plugged and permitted wells, not a count of producing wells.
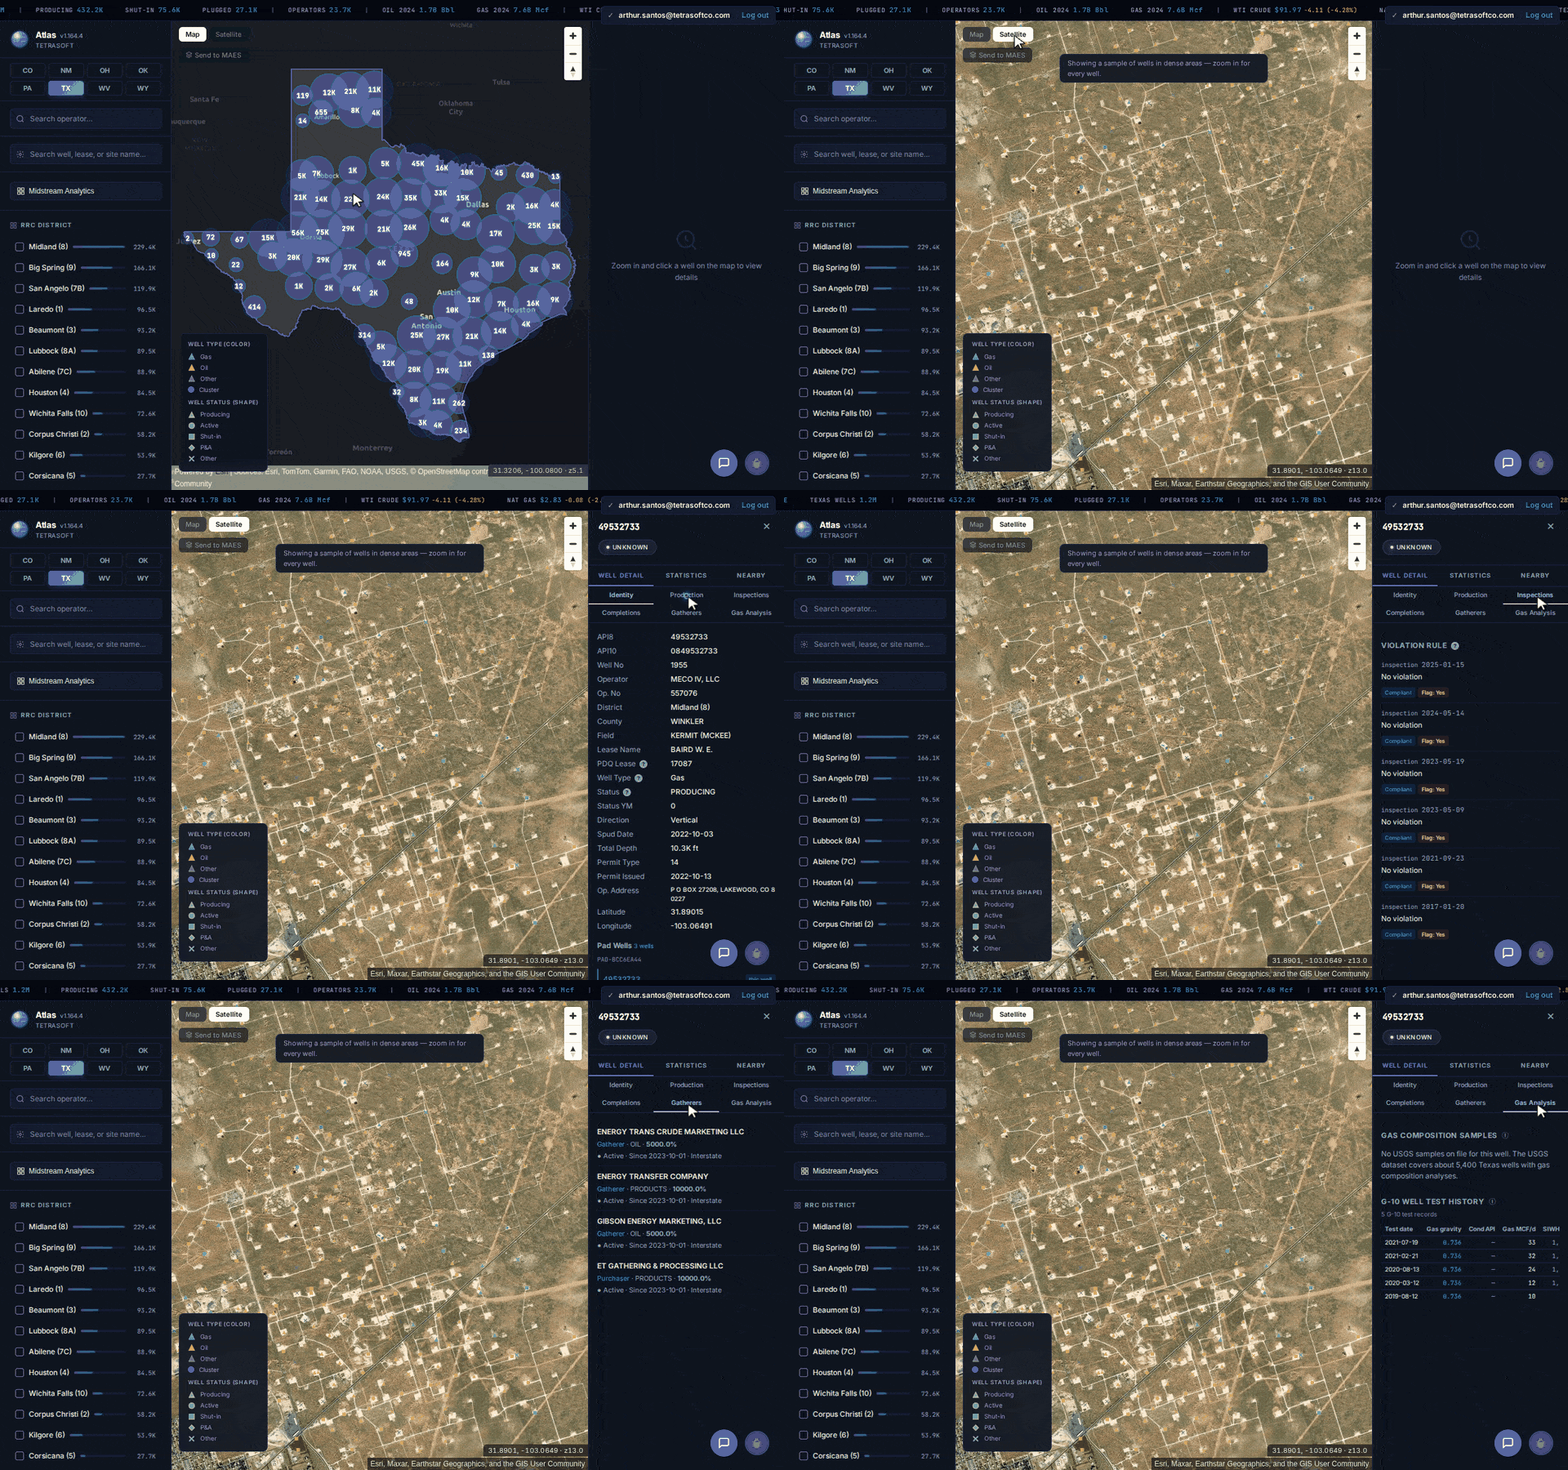
From basin-wide well clusters down to one Midland County well on the Spraberry trend, with its production history attached. [2]
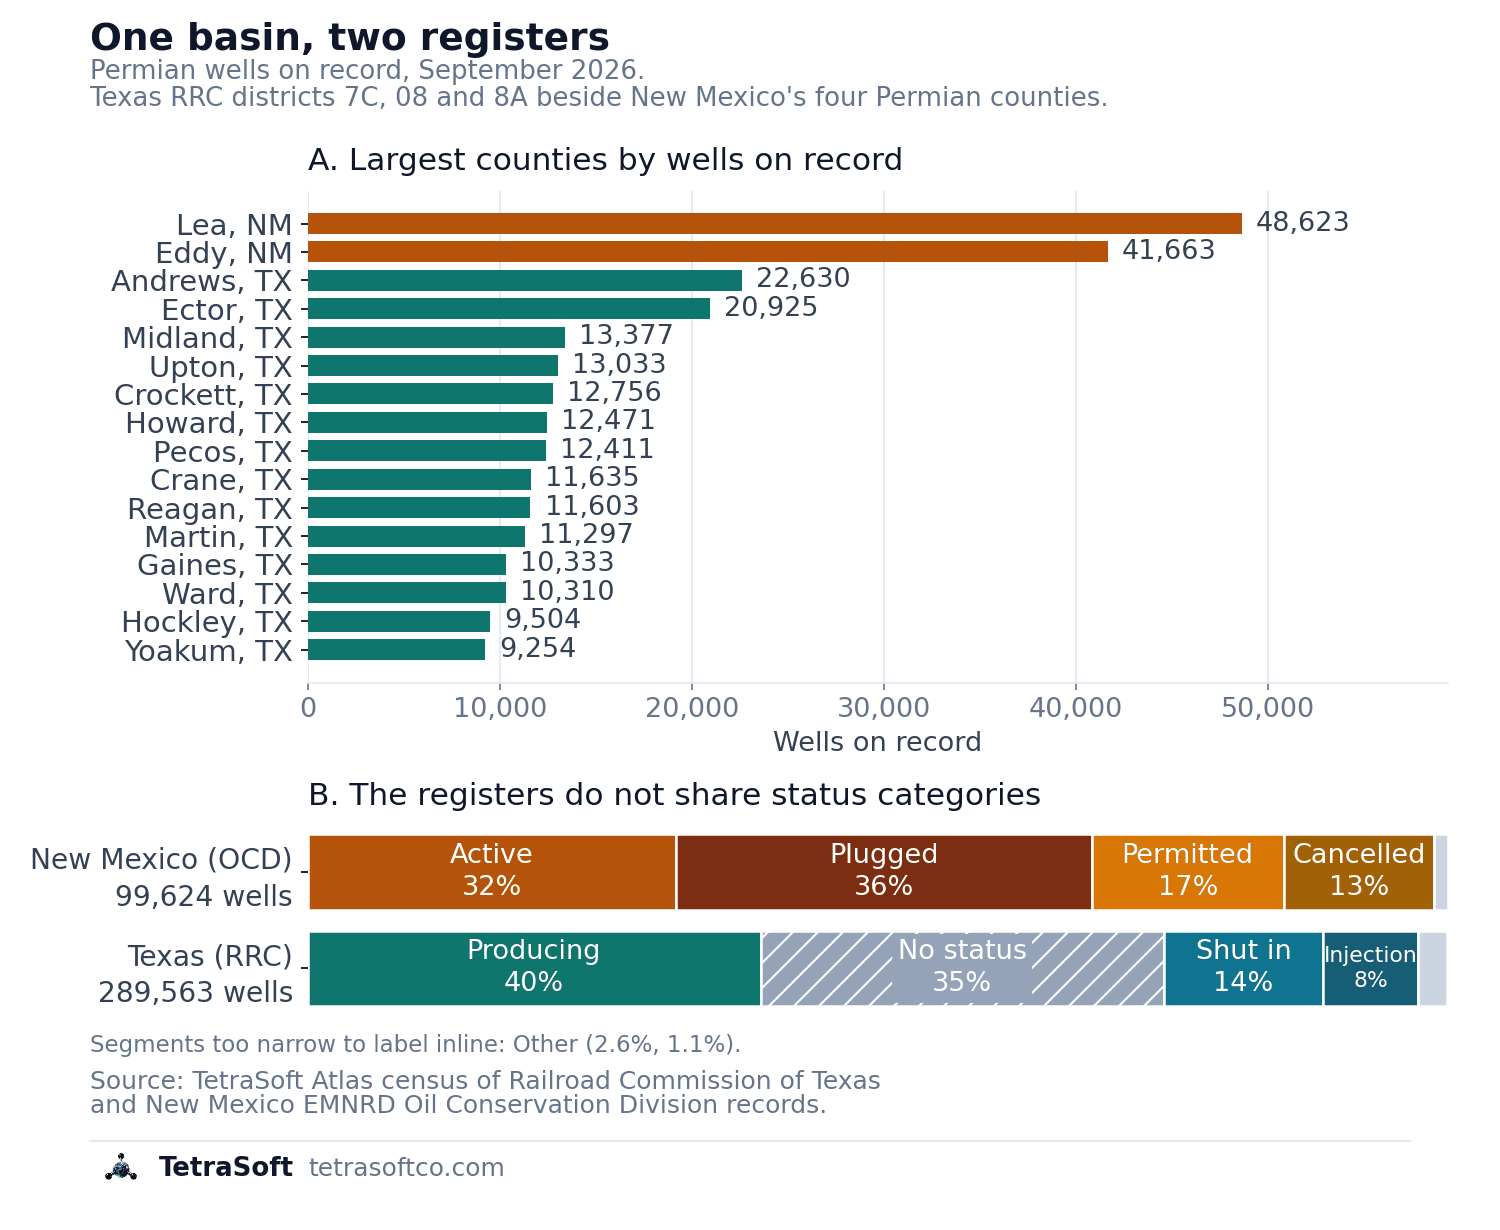
The basin’s two registers side by side: different leaders, and different status vocabularies. [2]
The Permian Splits Into a Midland Play and a Delaware Play
The Permian Basin covers 61,763 square miles across West Texas and southeastern New Mexico [4]. Inside that outline sit two separate shale fairways that carry most modern drilling. The Midland play runs down the eastern half and holds 121,172 wells on record [2]. The Delaware play sits to the west, crosses the state line, and holds 62,790 [3].
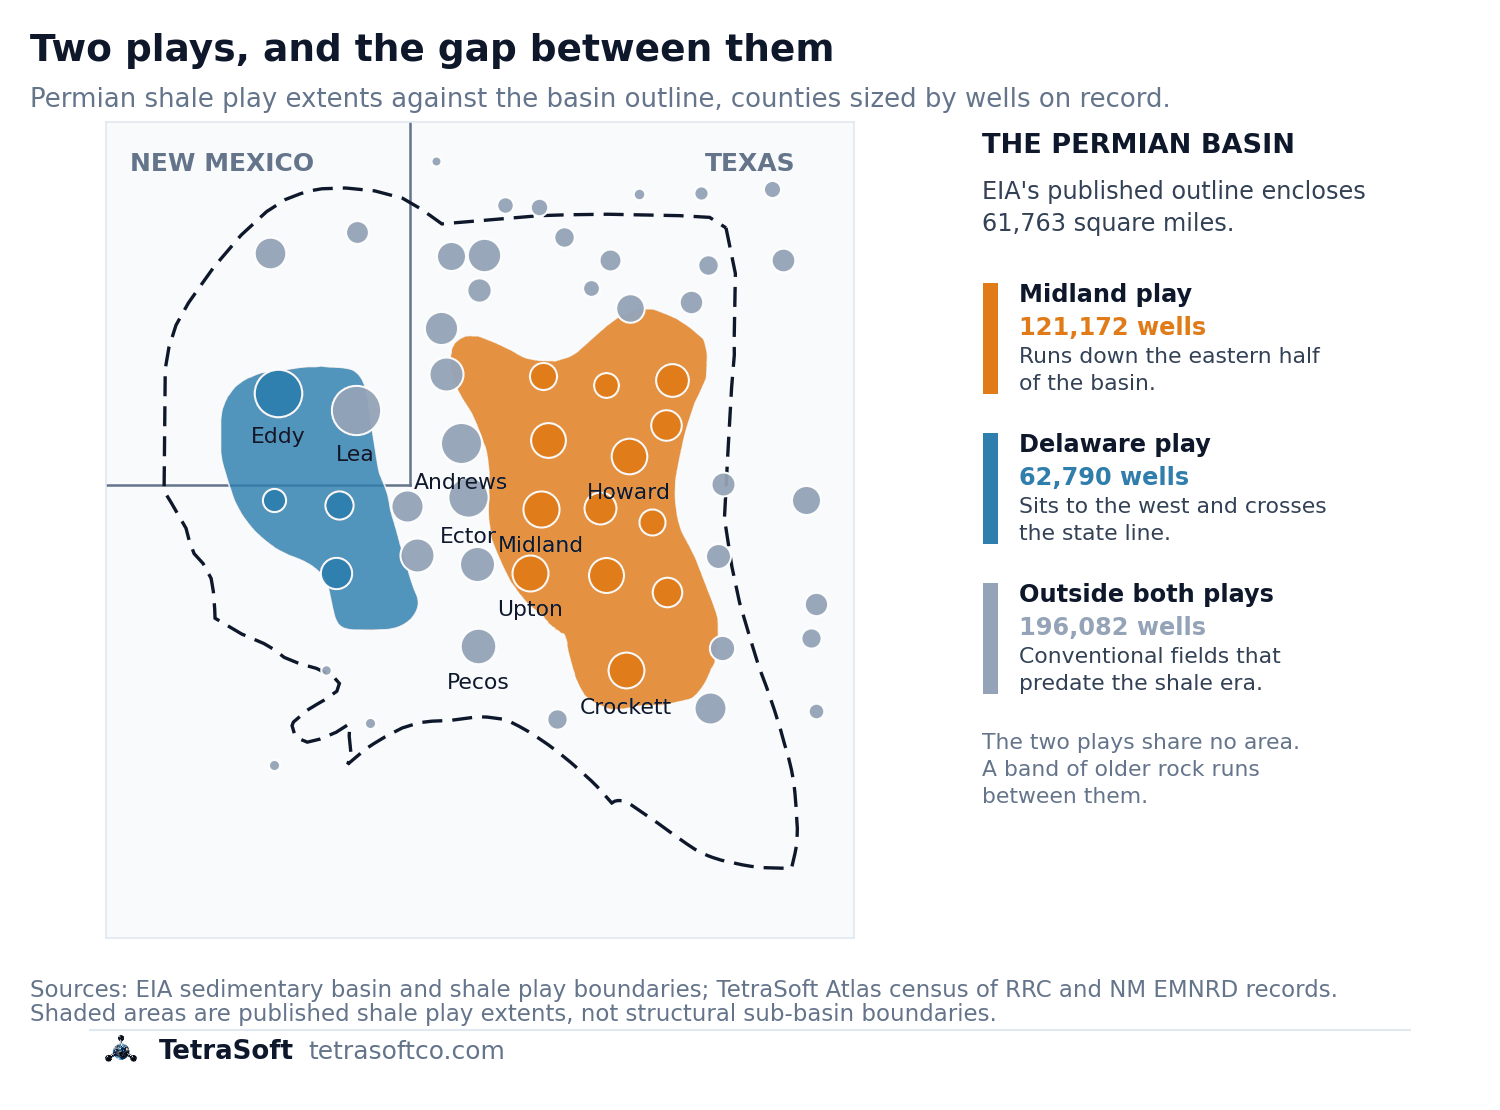
The two plays share no area at all [4]. A band of older rock runs between them where neither shale target is the objective.
Wells in the two plays look different in the record [2]. Among Texas wells in the basin’s western play, 47.8% were drilled horizontally [2]. Among Texas wells in the Midland play, the figure is 12.1% [2]. The median Texas well in that western play reached 11,300 feet [2].
The median Texas well in the Midland play reached 8,550 feet [2]. Depth and horizontal share are recorded in the Texas wellbore file [2]. The New Mexico register carries no equivalent columns [3].
That caveat matters more than it first appears. New Mexico holds 45,916 of that play’s wells [3]. A Texas-only percentage therefore describes the smaller part of that play.
The shaded areas are published shale play extents rather than structural sub-basin boundaries [4].
Half the Basin’s Wells Predate Both Shale Plays
Most Permian wells sit outside both shale fairways. On the Texas side, 142,390 wells fall outside both shale extents [2]. In New Mexico’s Permian counties, another 53,692 do [3]. Together that is 196,082 of the 380,044 mapped wells, or 51.6%.
The conventional fields the region ran on before shale make up most of that group. On the Texas side their median well was spudded in 1992 and reached 5,200 feet [2]. Only 3.1% were drilled horizontally [2]. The largest are Levelland with 6,431 wells, Wasson with 5,912 and Slaughter with 5,461 [2].
New Mexico’s share of that group reads the same way. Outside that play, 25,911 New Mexico wells are plugged against 19,974 active [3]. Inside the play, 15,227 are permitted but not yet drilled [3].
A county takes its colour on the map from whichever group holds most of its wells [2]. Lea is the clearest case, splitting 21,349 wells inside the Delaware play against 27,259 outside it [3].
A further 9,143 records carry no usable coordinate and cannot be placed on any map [2]. They stay inside the census of 389,187 rather than being quietly dropped [2].
Two Agencies Split the Basin’s 59 Counties Between Them
Two regulators hold the basin’s records, each covering only its own state [2]. An oil and gas district is the Railroad Commission’s own administrative unit [5]. It is a fixed group of counties served by one district office, where operators file and inspectors work from [5].
The boundaries are administrative rather than geological, so a district line does not follow the basin. Texas keeps its Permian wells in three of them, 7C, 08 and 8A, which together hold 289,563 wells [2]. Those three districts cover 55 Texas counties between them: 14 in 7C, 20 in 08 and 21 in 8A [5].
| District | Office | Wells on record | Every Permian county it covers |
|---|---|---|---|
| 7C | San Angelo | 68,802 | Upton, Crockett, Reagan, Sutton, Irion, Runnels, Schleicher, Tom Green, Coke, Concho, Terrell, Menard, McCulloch, Kimble |
| 08 | Midland | 154,438 | Andrews, Ector, Midland, Howard, Pecos, Crane, Martin, Ward, Winkler, Glasscock, Reeves, Mitchell, Loving, Sterling, Culberson, Hudspeth, Presidio, Brewster, Jeff Davis, El Paso |
| 8A | Lubbock | 66,323 | Gaines, Hockley, Yoakum, Scurry, Cochran, Garza, Dawson, Borden, Terry, King, Kent, Crosby, Dickens, Lubbock, Hale, Cottle, Lynn, Lamb, Motley, Floyd, Bailey |
| No RRC district | EMNRD Oil Conservation Division | 99,624 | Lea, Eddy, Chaves, Roosevelt |
District offices as published by the Railroad Commission. Each row names every county it contributes to this post’s basin scope, ordered by wells on record. [5] The three Texas district counts sum to 289,563, and no fourth district contributes a county [2]. New Mexico’s four counties answer to the Oil Conservation Division rather than to any Railroad Commission district [3].
The RRC treats districts 7C, 08 and 8A as the best representation of the Permian in its production figures [6]. That is an approximation of the basin rather than its geologic extent. District 8A reaches north onto the South Plains, well past the basin outline on the map above. Of the 66 counties holding a mappable Permian well, 48 sit mostly inside that outline [2].
Horizontal wells account for 27,238 of the Texas Permian inventory, roughly 9% [2]. The share stays low because the census counts decades of vertical wells drilled long before shale development. On the Texas side, 115,381 wells carry a producing status, 40,483 are shut in and 24,176 are injection wells [2]. Another 102,762 carry no status value at all [2].
Lea and Eddy Counties Produced 732 Million Barrels in 2024
New Mexico’s two core Permian counties produced 731,806,908 barrels of oil in 2024 [3]. Statewide output was 744,619,515 barrels, so those two counties account for 98% of it [3]. Lea contributed 427,471,690 barrels and Eddy 304,335,218 [3]. Gas ran the other way, with Eddy at 1.60 trillion cubic feet against Lea’s 1.42 trillion [3].
Volumes here are New Mexico’s, and the reason is the reporting unit rather than an oversight. Texas files oil production by lease, so a Texas county volume would require splitting lease totals across counties [2]. Three formations carry most of the basin’s growth: Bone Spring, Spraberry and Wolfcamp [7].
Both counties grew year over year [3]. Lea rose 8.2% from 394,942,700 barrels in 2023, and Eddy rose 15.0% from 264,706,578 [3]. The Texas side grew too, and one district’s jump was large enough to move state totals. Texas growth is covered in Southern Permian Oil Jumped 14% in 2024: Emissions Impact.
EIA ranks the same two counties first for growth [7]. Lea and Eddy added nearly 1.0 million barrels per day between 2020 and 2024, 52% of all US production growth [7]. Ten Permian counties together averaged 4.8 million barrels per day in 2024, 37% of the US total [7]. EIA credits Enverus for that county layer rather than either state’s filings [7].
EIA publishes the basin-wide production figure because the basin itself crosses a state line, which neither state register does.
Oil Companies in the Permian Basin: Occidental and EOG Lead Each Side
Occidental Permian Ltd. holds the most wells in Ector, Gaines, Hockley and Yoakum counties [2]. Pioneer Natural Resources leads Midland, Upton, Reagan and Martin [2]. In total, 10,480 distinct operator names appear across the Texas side [2].
New Mexico’s leaderboard reads differently, with no operator common to both lists. EOG Resources leads Lea County and Mewbourne Oil leads Eddy [3]. One caution applies to anyone querying that file directly.
Its largest operator by well count is a placeholder left from the state’s pre-ONGARD data migration, not a company [3]. Operator rankings shift as acreage changes hands, so these standings are a September 2026 snapshot.
How TetraSoft Atlas Searches Both States’ Permian Records Together
TetraSoft Atlas keeps every Permian well addressable on one map with its own state’s records attached [2]. Reaching that point means reconciling two agencies that never agreed on a key. New Mexico files one row per well, keyed to a 10-digit API number [3].
Texas and New Mexico, the two states the Permian spans, were the two largest oil-producing states in 2025 [9]. Atlas is self-serve, with no sales call: you sign up and start a 7-day trial with no credit card [8].
Texas files one row per field completion, so a wellbore producing from three reservoirs appears three times [2]. That difference is worth a quarter of the Texas count [2]. Counting Texas rows rather than distinct API numbers turns 289,563 Permian wells into 383,566 [2].
Neither number is wrong, but only one of them is a well count. Line the two states up without noticing, and the mismatch stays silent because both files look complete on their own.
Atlas will not merge the two states into a single production series. The underlying reporting units genuinely differ, so a combined series would be arithmetic on two different things. What Atlas does instead is resolve the Texas completion rows to distinct wellbores before the two registers are put side by side [2]. A basin-wide question then resolves in one place rather than two portals.
The Texas records run through the same pipeline as RRC Wellbore Query: How to Find Any Texas Well Record. The New Mexico side runs through NMOCD Well Search: Map Every New Mexico Oil & Gas Well. For named-field work rather than county work, the same records drive Oil Field Map: How to Find Any Named Field’s Wells.
Reconciliation prevents one specific error, a double count. A wellbore producing from three reservoirs is three Texas rows, and counting rows rather than wellbores inflates the Texas total [2]. The two registers cannot double-count each other, because each covers only its own state. Explore the basin’s two-state record set on the TetraSoft Atlas Dashboard.
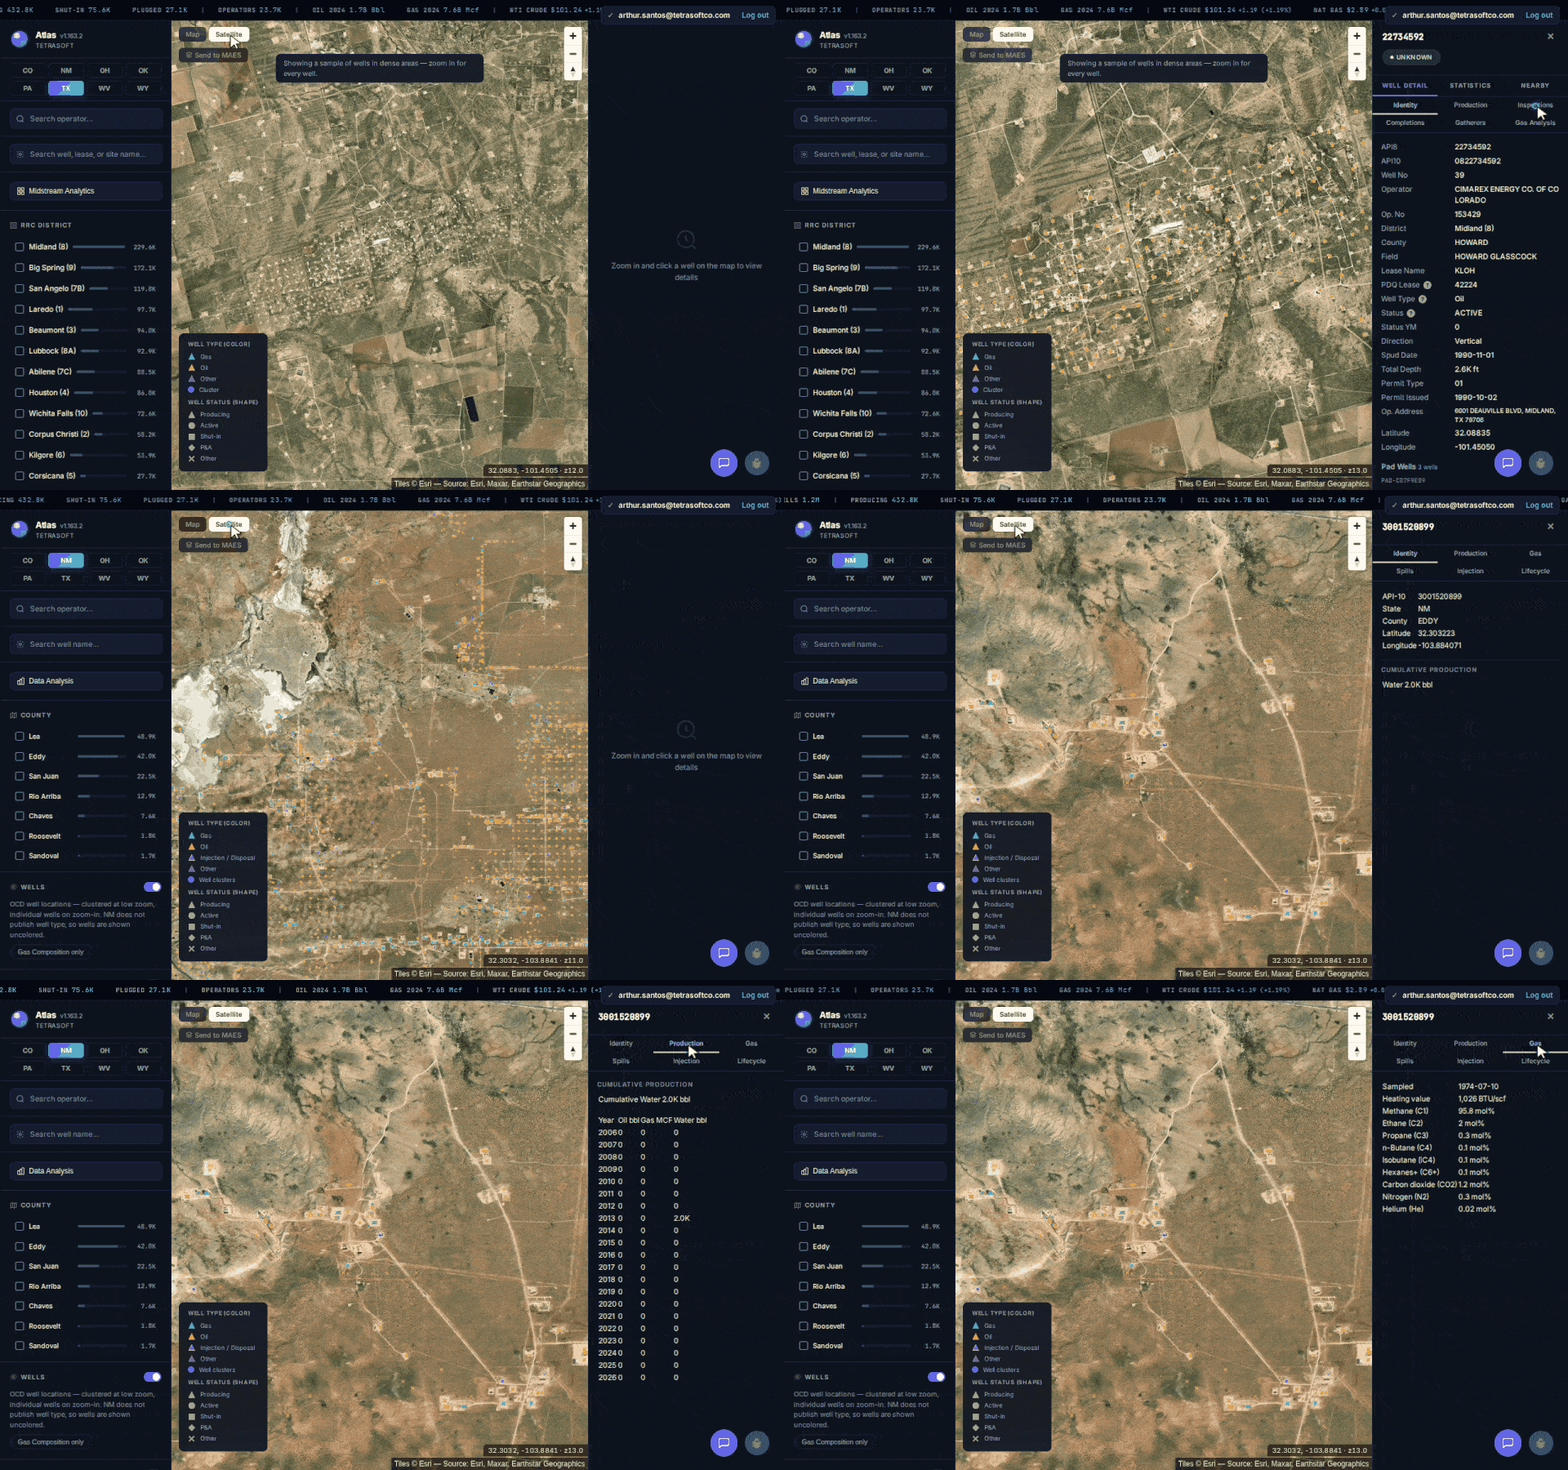
Each state keeps its own record set. The New Mexico panel carries Spills, Injection and Lifecycle tabs; the Texas panel carries Inspections, Completions and Gatherers. Atlas keys them to one map without flattening either into the other.
Frequently Asked Questions
Where is the Permian Basin, and how big is it?
EIA’s published Permian outline encloses 61,763 square miles [4]. The basin sits under West Texas and southeastern New Mexico [4].
Counts of “Permian counties” vary because they answer different questions. Fifty-five sit across three Texas Railroad Commission districts [2]. Four more sit in New Mexico’s Permian counties [3]. Together they are the fifty-nine this post counts, an administrative scope rather than a geologic one.
How deep are Permian wells?
The median Texas Permian well on record reaches 6,700 feet [2]. The deeper modern wells cluster well below that, with 10% past 11,500 feet and 1% past 15,600 feet [2]. Depth tracks the target rather than the era, which is why the western play’s median sits about 2,750 feet below the Midland play’s.
Which formations do Permian Basin wells target?
In New Mexico’s Permian counties, Bone Spring leads the named formations with 5,908 wells [3]. Wolfcamp follows with 2,791, then San Andres with 1,868 and Delaware with 1,836 [3]. The Texas side records a field name rather than a formation [2]. The two states do not label their targets the same way.
What does a Texas well with no recorded status mean?
A blank status means the Railroad Commission’s wellbore record carries no status value for that well [2]. It is not a finding that the well is idle, plugged or producing, and treating it as any of those invents a fact. Filter a Texas county by status and those wells drop out of every bucket at once.
How much does TetraSoft Atlas cost?
Atlas is sold on subscription, with plans scaled from an individual analyst to a large operator team [8]. Every paid plan starts with a seven-day free trial, and you can cancel anytime [8]. Current plans and prices are on the Atlas pricing page, which is the only place they are kept up to date [8].
All 380,044 located Permian wells sit on one map, each carrying its own agency’s production, operator, and status records [2]. Start your free 7-day trial.
This post is for informational purposes only and does not constitute legal or compliance advice. Consult qualified legal counsel or a compliance professional for guidance specific to your operations and jurisdiction.
References
- U.S. Energy Information Administration, U.S. crude oil production rose by 2% in 2024, Today in Energy, April 16, 2025
- TetraSoft Atlas, Texas dataset from Railroad Commission of Texas records
- TetraSoft Atlas, New Mexico dataset from EMNRD Oil Conservation Division records
- U.S. Energy Information Administration, sedimentary basin and shale play boundaries, Maps: Oil and Gas Exploration, Resources, and Production
- Railroad Commission of Texas, Oil & Gas Counties & Districts. Searchable listing of Texas counties and their assigned oil and gas district, with each district’s office location. https://www.rrc.texas.gov/about-us/locations/oil-gas-counties-districts/
- Railroad Commission of Texas, Permian Basin, Major Oil and Gas Formations
- U.S. Energy Information Administration, Ten counties in the Permian Basin account for 93% of U.S. oil production growth since 2020, Today in Energy, September 2, 2025
- TetraSoft Atlas pricing page, tetrasoftco.com/atlas-landing.html
- U.S. Energy Information Administration, crude oil field production and natural gas marketed production by state, annual 2025, accessed 23 September 2026. https://www.eia.gov/dnav/pet/pet_crd_crpdn_adc_mbbl_a.htm; https://www.eia.gov/dnav/ng/ng_prod_sum_a_EPG0_VGM_mmcf_a.htm
Interactive tool
Permian county explorer
Every county in the basin's two registers, 389,187 wells in all. Texas counties come from Railroad Commission districts 7C, 08 and 8A; New Mexico counties from the Oil Conservation Division census.
55 Texas counties and 4 New Mexico counties
Wells on record in Lea County
48,623
New Mexico Oil Conservation Division register
Status mix
- Operators on record
- 930
- Most wells held by
- EOG Resources Inc
- Oil produced, 2024
- 427,471,690 bbl
- Gas produced, 2024
- 1,420,706,272 Mcf
- Shale play
- Outside both plays
48,608 of 48,623 placed by coordinate: 21,349 in the Delaware play, 27,259 outside both.
Texas reports oil production by lease rather than by well, so no per-county Texas volume is published here. A lease-allocated barrel cannot be assigned to one county without inventing the split.
TetraSoft Atlas census of Railroad Commission of Texas and New Mexico EMNRD Oil Conservation Division records, September 2026. Counts are wells on record, which includes plugged and permitted wells, not a count of producing wells. Nothing leaves your browser.
Comments
0Share your thoughts. All comments are moderated before appearing.
No comments yet. Be the first to share your thoughts!