The RRC GIS Viewer, also called the Texas Railroad Commission GIS viewer, is the agency’s public web map of oil and gas activity across the state [1]. The agency answers to RRC, TRRC, and the full name in equal measure, and the viewer is the same one behind each. The Commission’s own data sources table lists 22 layers behind it [1]. Its Wells layer covers oil, gas, injection, and other wells the Commission regulates [1]. Five layers come straight from Commission records, and the rest is base geography or boundaries derived from it [1].
What no layer carries is the record behind a well. Production volumes, drilling permits, and completions are distributed as separate download files instead [2]. So the viewer answers where a well is, and the rest of the question takes another tool. Every well on that map also sits in TetraSoft Atlas, a subscription data platform, with its permit, production, and inspection record attached [3].
Quick Answer: The RRC GIS Viewer maps Texas oil and gas across 22 layers, including wells, pipelines, districts, surveys, and restricted drilling areas [1]. It carries no production, permit, or completion data, which the Commission publishes as separate downloads [2]. Atlas maps the same 1,210,912 Texas wells with those records attached to each one.
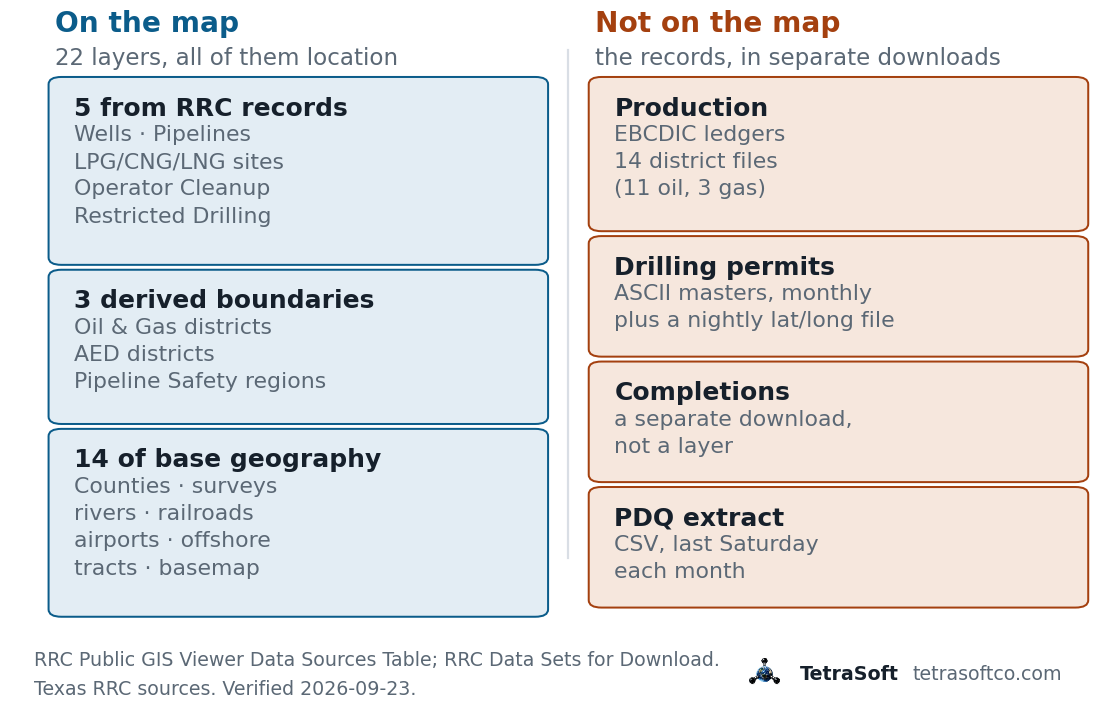
The viewer answers where. Every record a reader wants next arrives somewhere else, in a format of its own [1][2].
What the RRC GIS Viewer Maps
The viewer’s 22 layers fall into three groups, and only the first is oil and gas data. Five layers come straight from Railroad Commission records [1]. Those are Wells, Pipelines, LPG/CNG/LNG Sites, Operator Cleanup Program Sites, and Restricted Drilling Alert Areas [1].
Three more layers are administrative boundaries the Commission derives from its Counties layer [1]. They cover the Oil and Gas Division districts, the AED Division districts, and the Pipeline Safety Division regions [1]. Texas well records span 13 oil and gas districts, and those district codes drive most Commission reporting.
The remaining fourteen layers are base geography rather than regulatory data. They cover counties, city limits, rivers and creeks, railroads, airports, cemeteries, government lands, subdivisions, and land surveys [1]. Offshore work gets its own set, with Bay Tracts, Gulf Areas, Offshore Tracts, and a coastal county extension to the Three League Line [1]. ESRI supplies the basemap underneath all of it [1].
Every layer, with the source the Commission gives for it [1]:
| Layer | Group | Digital data source |
|---|---|---|
| Wells | RRC records | Railroad Commission public records |
| Pipelines | RRC records | Railroad Commission public records |
| LPG/CNG/LNG Sites | RRC records | Railroad Commission public records |
| Operator Cleanup Program Sites | RRC records | Railroad Commission public records |
| Restricted Drilling Alert Areas | RRC records | Railroad Commission records |
| RRC Oil and Gas Districts | Derived boundary | Counties layer and RRC public records |
| RRC AED District Boundaries | Derived boundary | Counties layer and RRC public records |
| RRC Pipeline Safety Regions | Derived boundary | Counties layer and RRC public records |
| Counties | Base geography | Digitized from USGS 7.5 minute quadrangles |
| Counties Offshore | Base geography | Digitized from USGS 7.5 minute quadrangles |
| Surveys | Base geography | GLO county maps interpreted onto USGS quadrangles |
| Subdivisions | Base geography | RRC lines interpreted onto USGS quadrangles |
| Rivers, Creeks, Streams, etc. | Base geography | Digitized from USGS 7.5 minute quadrangles |
| Railroads | Base geography | Digitized from USGS 7.5 minute quadrangles |
| Airports | Base geography | Digitized from USGS 7.5 minute quadrangles |
| Cemeteries | Base geography | Digitized from USGS 7.5 minute quadrangles |
| Government Lands | Base geography | Digitized from USGS 7.5 minute quadrangles |
| City Limits | Base geography | 2012 US Census |
| Bay Tracts | Base geography | Digitized from Texas General Land Office maps |
| Gulf Areas | Base geography | Digitized from MMS Texas OCS leasing maps |
| Offshore Tracts | Base geography | Digitized from MMS Texas OCS leasing maps |
| Basemap | Base geography | ESRI |
The Pipelines layer is the one that surprises people who came for wells. It covers natural gas, crude oil, and refined product lines from Commission records [1]. For how those lines are mapped and who operates them, see Natural Gas Pipeline Map: Lines, Operators, and Safety.
Where the Layers Come From
Driving it runs through a handful of named controls. Layer visibility options decide what is drawn, a dynamic legend tracks the result, and a consolidated identify tool returns the record behind a feature you click [4]. The search side is split: a refined API search tool for a well, a combined point of interest and address search for a place, and searches for survey, pipeline, and lease ID [4]. Measurement and user-defined radius tools sit alongside them, with a dynamic coordinates readout [4].
Most of the viewer’s geography was digitized from paper topographic maps [1]. Nine of the 22 layers were digitized or interpreted onto U.S. Geological Survey 7.5 minute quadrangle maps [1]. Bay Tracts came from Texas General Land Office maps, and the offshore layers from federal Minerals Management Service leasing maps [1]. City Limits comes from the 2012 US Census [1].
A city boundary that has not moved since 2012 is a real caveat to carry into a siting conversation. The Surveys layer carries the Commission’s own warning about exactly this kind of use [1]. It states the layer is “not a survey grade product and should not be used to define or establish survey boundaries.” [1] Read the land grid as orientation rather than as a legal boundary.
What the Viewer Leaves Out, and Where That Data Lives
Production, permits, and completions each live in their own download file rather than on the map [2]. The Commission publishes them free of charge through its Data Sets Available for Download page [2]. The formats are where the work starts.
The GIS layers themselves download as ArcView shape files, one county at a time [2]. Pipeline, survey, well, base, and all-layer bundles are each selected by county FIPS code [2]. Statewide coverage therefore means repeating that download for every county in the state. Texas well records span 254 named counties.
Production is distributed in an older form still. The oil and gas ledgers publish in EBCDIC, an IBM mainframe character encoding, split across 14 district files [2]. Eleven of those cover oil by district and three cover gas [2]. Finding a 1960s mainframe encoding offered as a current download format is a jolt.
Drilling permits follow their own track and their own schedule [2]. The permit master files come as ASCII, monthly, with a nightly file that adds latitude and longitude [2]. A Production Data Query dump is offered separately in CSV, refreshed the last Saturday of each month [2].
The Commission is explicit that the rest is the reader’s problem [2]. Its download page states: “The conversion of the data and choice of conversion tools is the responsibility of the user.” [2] Joining a county shapefile to a district ledger to a permit master is the actual task behind most Texas well questions.
How to See a Texas Well and Its Record Together
One lookup should return a well’s location and its history on the same screen. Atlas maps 1,210,912 Texas wells from Railroad Commission records, each opening with its record attached. Searching by API number, lease, operator, or county resolves straight to the well [3]. For how to read those digits before you search, see API Well Number Lookup: What It Is and How to Read One.
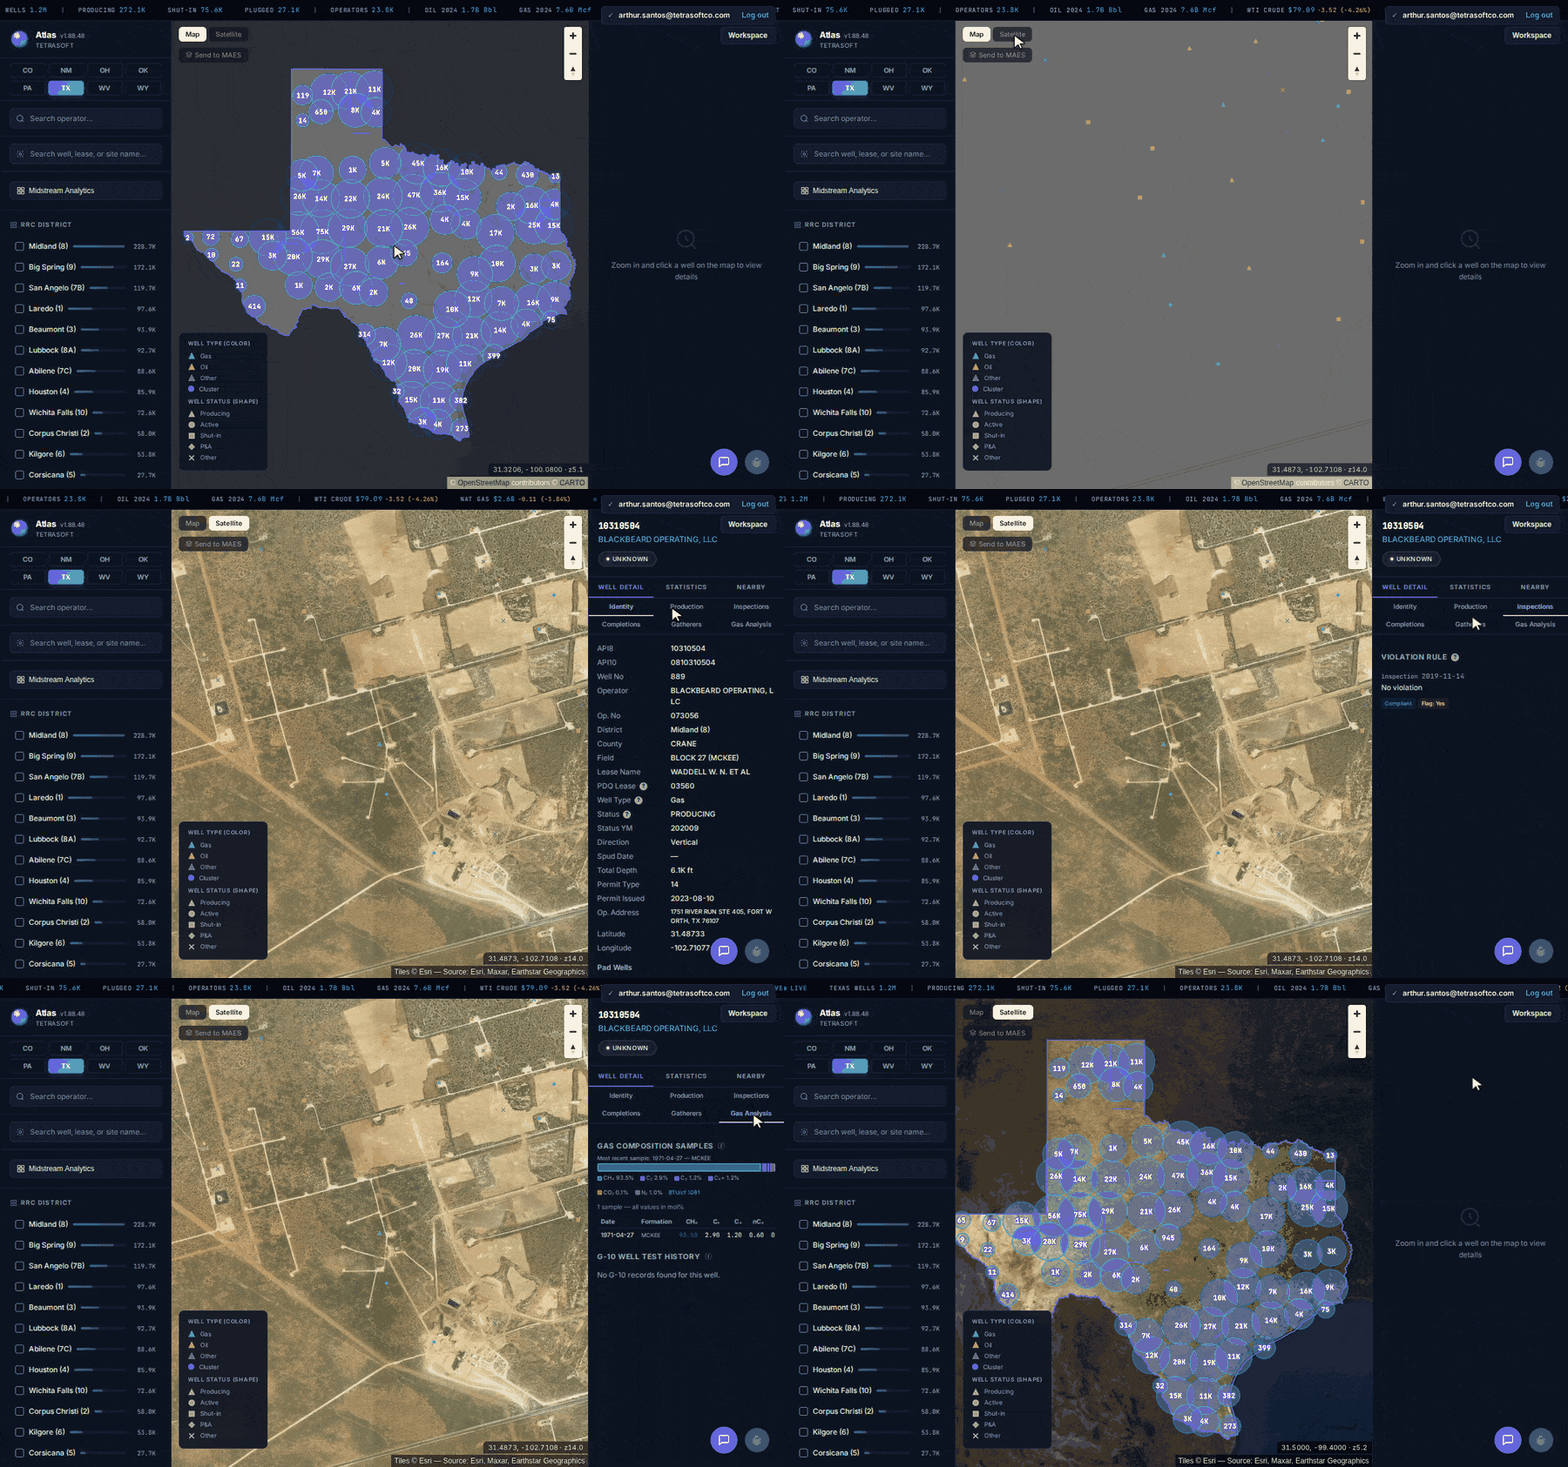
From statewide clusters down to one lease’s full record: permit, production, inspections, completions, gatherers, and gas analysis. [3]
Atlas carries 734,212 drilling permits and about 343 million monthly production records from the Commission. Inspection history adds roughly 2.57 million records against those wells. You can run that lookup on the Texas oil and gas map in a few seconds [3].
Scale is what makes the join expensive in Texas rather than merely tedious. District 08, the Midland core of the Permian Basin, holds 228,670 wells on its own. About 23,800 distinct operators appear across the Texas records, from majors to single-well owners. For the production trend behind that concentration, see Southern Permian Oil Jumped 14% in 2024: Emissions Impact.
Part of the well record reaches past what the Commission publishes at all. Where a gas sample exists for a well, its composition sits beside the RRC record [3]. The breakdown covers methane, heavier hydrocarbons, carbon dioxide, and nitrogen, with a heating value in BTU per cubic foot [3].
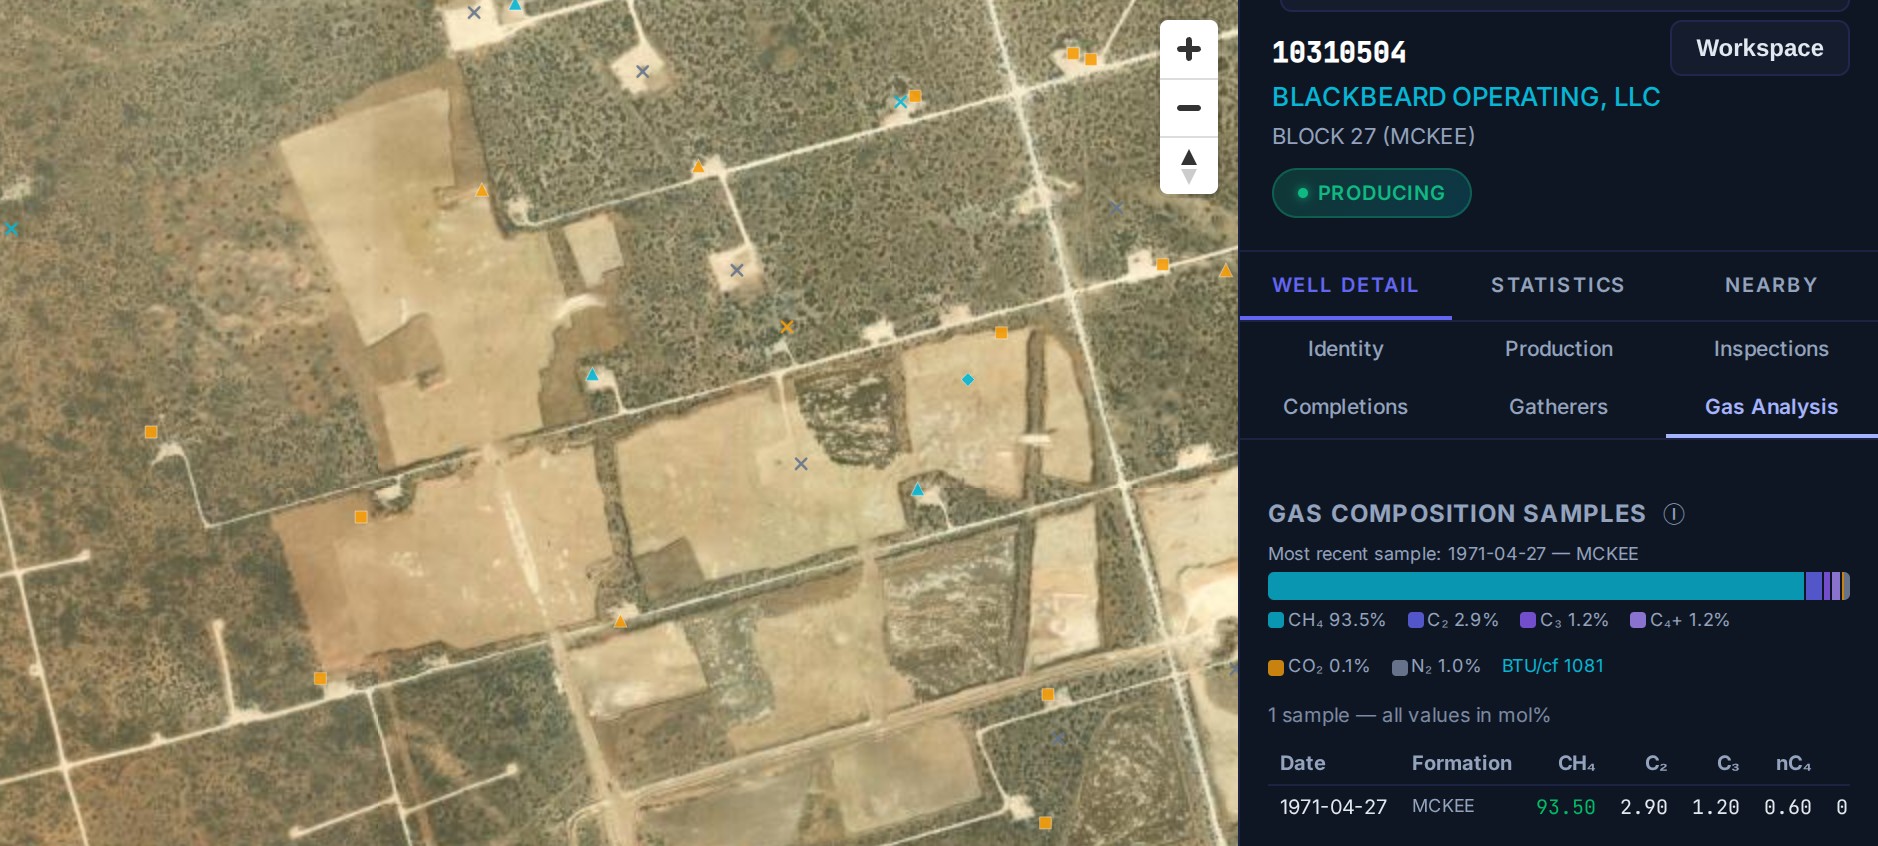
A well’s gas composition sits on the same screen as its Commission permit, production, and completion record. [3]
Frequently Asked Questions
Is the RRC GIS Map the Same as the Public GIS Viewer?
Yes, the RRC GIS map, the RRC GIS viewer, and the Texas Railroad Commission GIS map all name one tool. Its formal name in Commission documentation is the Public GIS Viewer [1]. The Wells layer inside it is what most of those searches are actually after.
Does the RRC GIS Viewer Show Production Data?
No, and the reason is structural rather than a gap in the map. The Commission states that “in Texas, production is reported by each oil and gas lease rather than individual well.” [5] Production sits in the Production Data Query system, covering January 1993 to present [5].
How Do I Download Railroad Commission GIS Data?
Through the Commission’s Data Sets Available for Download page, selecting one county at a time [2]. You choose a Pipeline, Survey, Well, Base, or All Layers bundle, then pick the county by its FIPS code [2]. The files arrive as ArcView shape files, and the Commission refreshes them twice a week [2].
How Current Is the Data Behind the Viewer?
Cadence varies by data set, and production carries a built-in delay on top of it [5]. Operators file production on the last day of the month for the previous month [5]. The Commission says that creates “a two-month lag time for online production information.” [5] Numbers also revise afterward as corrected and delinquent reports arrive [5].
Can I See Plugged and Inactive Wells on the Map?
Yes, the Wells layer covers wells the Commission regulates rather than only producing ones [1]. That includes injection wells alongside oil and gas wells [1]. Atlas keeps the same coverage and holds each well’s history whether or not it still produces [3].
How Much Does TetraSoft Atlas Cost?
Atlas is priced by team size, starting at a single seat [3]. Every plan starts with a seven-day free trial, and you can cancel anytime [3]. For current plans and prices, see the Atlas pricing page [3].
The Railroad Commission’s map does one job well, which is telling you where a Texas well sits. Atlas puts that well’s permit, production, inspection, and gas record on the same screen [3]. Start your free 7-day trial.
This post is for informational purposes only and does not constitute legal or compliance advice. Consult qualified legal counsel or a compliance professional for guidance specific to your operations and jurisdiction.
References
- Railroad Commission of Texas, Public GIS Viewer Data Sources Table. https://gis.rrc.texas.gov/gisviewer/GISViewer/docs/publicVeiwerDST.pdf
- Railroad Commission of Texas, Data Sets Available for Download. https://www.rrc.texas.gov/resource-center/research/data-sets-available-for-download/
- TetraSoft Atlas, Texas oil and gas dataset and product features. https://tetrasoftco.com/atlas-landing.html#pricing
- Railroad Commission of Texas, Public GIS Viewer (Map) resource page. https://www.rrc.texas.gov/resource-center/research/gis-viewer/
- Railroad Commission of Texas, Production Data Query System (PDQ) FAQs. https://www.rrc.texas.gov/about-us/faqs/oil-gas-faq/production-data-query-system-faqs/
Comments
0Share your thoughts. All comments are moderated before appearing.
No comments yet. Be the first to share your thoughts!