A saltwater disposal well takes produced water from oil and gas operations and injects it into a formation for permanent disposal [1]. It is one use of a Class II injection well, a class that also covers enhanced recovery and hydrocarbon storage [1]. A disposal well discards its water; an enhanced recovery well pushes water through a producing formation, sweeping oil toward nearby producing wells [1]. Across seven states with published records, 172,185 wells are permitted to inject, and 45,637 of those, roughly one in four, are permitted for disposal [2].
Finding them means going state by state, because each agency publishes its own vocabulary and its own file format. Every one of those wells sits on one map in TetraSoft Atlas, our subscription platform that joins well, production, emissions, and enforcement records.
Quick Answer: Seven states publish 172,185 permitted injection wells, of which 45,637 are permitted for disposal rather than enhanced recovery [2]. Texas alone accounts for 36,918 of the disposal wells [3]. The disposal share is not comparable between states, because vocabulary, well-population age, and real practice all move it.
A Disposal Well and an Injection Well Are Not the Same Thing
Every disposal well is an injection well, and most injection wells are not disposal wells [2]. Both sit in Class II of the federal Underground Injection Control program, and both put fluid into a permitted underground formation [1]. The wellbore construction is largely the same, so the permit, not the equipment, is what separates them.
Permanent disposal and pushing oil sound contradictory in a single sentence, and the resolution is that no single well does both jobs at once. A disposal well discards: water separated from the oil and gas at the surface is reinjected underground and left there [1]. An enhanced recovery well is part of a production scheme: its water enters the oil-bearing formation and drives residual oil toward producing wells [1]. One class, opposite jobs, and the permit type says which job a given well holds.
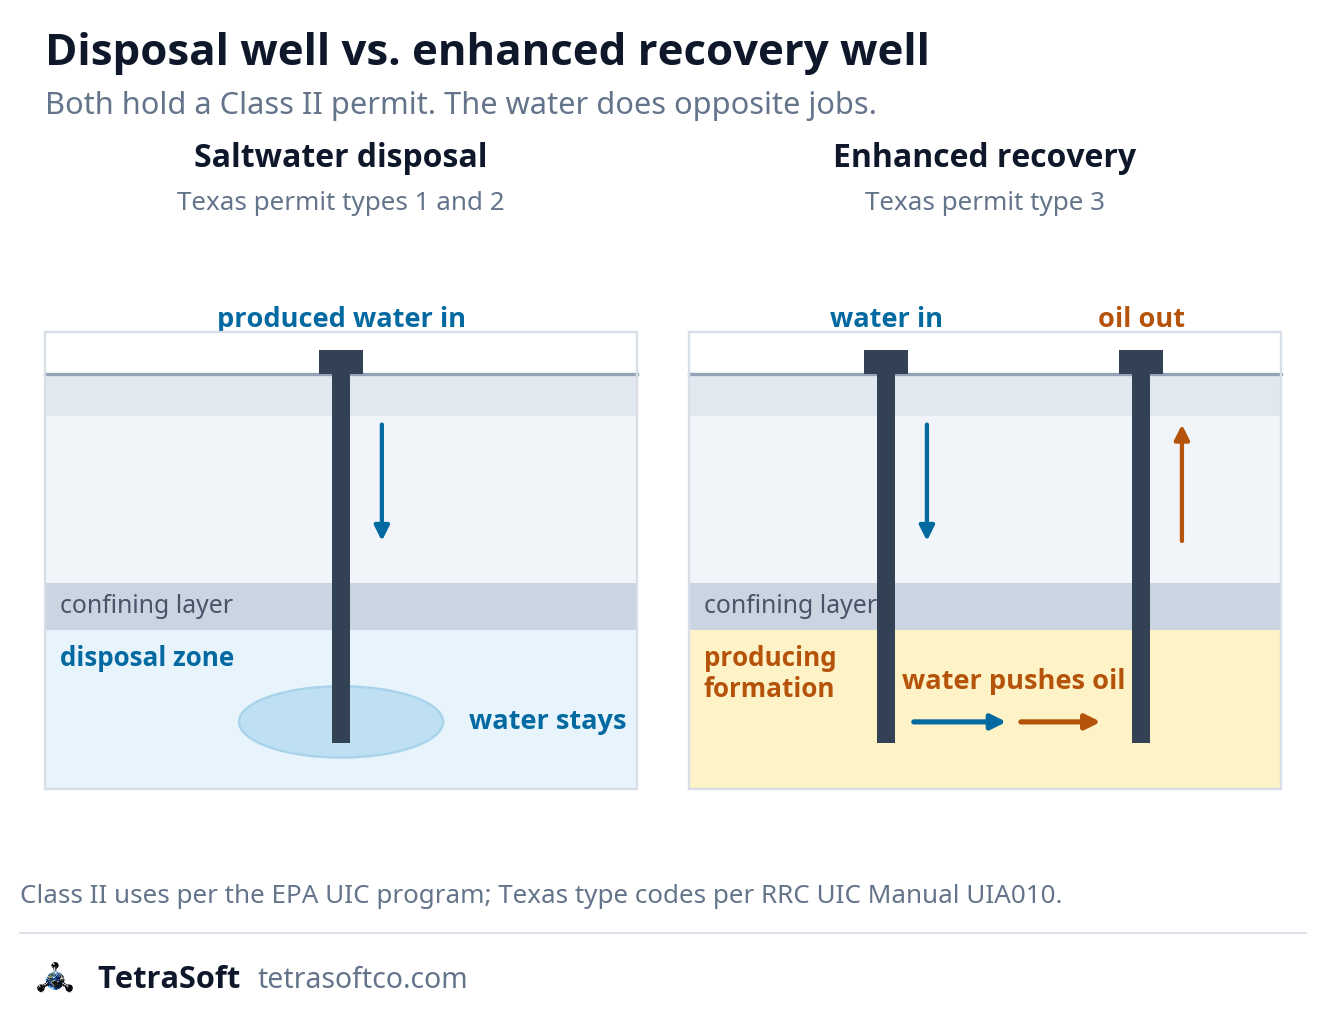
Two Class II permits, two different jobs. The disposal well leaves its water in a formation chosen to hold it; the enhanced recovery well drives water through the oil zone toward a producer [1].
Class II Is One of Six Injection Well Classes
Class II is the oil and gas class, one of six federal injection well classes defined by what goes down the well [4]. The class number says nothing about depth or construction; it says what the well is permitted to inject [4].
| Class | What goes down the well |
|---|---|
| Class I | Hazardous and non-hazardous waste, into deep, isolated rock formations |
| Class II | Fluids tied to oil and gas production: produced water disposal, enhanced recovery, and hydrocarbon storage |
| Class III | Fluids that dissolve and extract minerals (solution mining) |
| Class IV | Hazardous or radioactive waste into or above a drinking water source |
| Class V | Non-hazardous fluids, mostly into or above underground sources of drinking water |
| Class VI | Carbon dioxide for long-term geologic sequestration |
The six federal UIC classes. Saltwater disposal lives inside Class II, alongside enhanced recovery and hydrocarbon storage [4].
Within Class II, EPA puts enhanced recovery at up to 80 percent of the well count and disposal near 20 percent [1]. The full taxonomy, class by class, is set out in the companion post on UIC Well Classes: Class II, Class VI, and Where to Look.
Texas Writes the Distinction Into the Permit
Texas is unusually explicit about the disposal-versus-recovery split, and its permit file carries the answer directly. The Railroad Commission assigns each permitted injection well a type code, documented in its UIC manual [5]. Type 1 is disposal into a nonproductive zone, filed on form W-14, and type 2 is disposal into a productive zone, filed on form H-1 [5].
Type 3 is secondary or tertiary recovery, which is the enhanced recovery case [5]. Codes 4 through 7 cover miscellaneous types and underground storage, renumbered in 1995 without changing what disposal and recovery mean [5]. A reader wanting saltwater disposal wells specifically wants types 1 and 2.
Most Injection Wells Are Not Disposal Wells
The headline number people expect is usually the wrong one. Texas permits 126,709 injection wells in total, and 88,034 of them carry a secondary or tertiary recovery permit [3]. The disposal wells number 36,918 [3]. Quoting the larger figure as a disposal count overstates it by more than three times.
That file is cumulative, which trips up the count a second way [3]. It carries every permit ever issued, including 53,689 that record a cancellation date [3]. Filtering to permits activated and never cancelled leaves 59,924 wells, of which 15,365 are permitted for disposal and 43,348 for enhanced recovery [3].
A widely repeated figure puts Texas at more than 54,000 saltwater disposal wells. The Commission’s own injection and disposal wells FAQ counts 54,700 permitted injection and disposal wells together, not disposal alone [6]. Of about 34,200 then active, it placed roughly 8,100 in the disposal category [6]. Those figures date from July 2015, and the permit file has grown since.
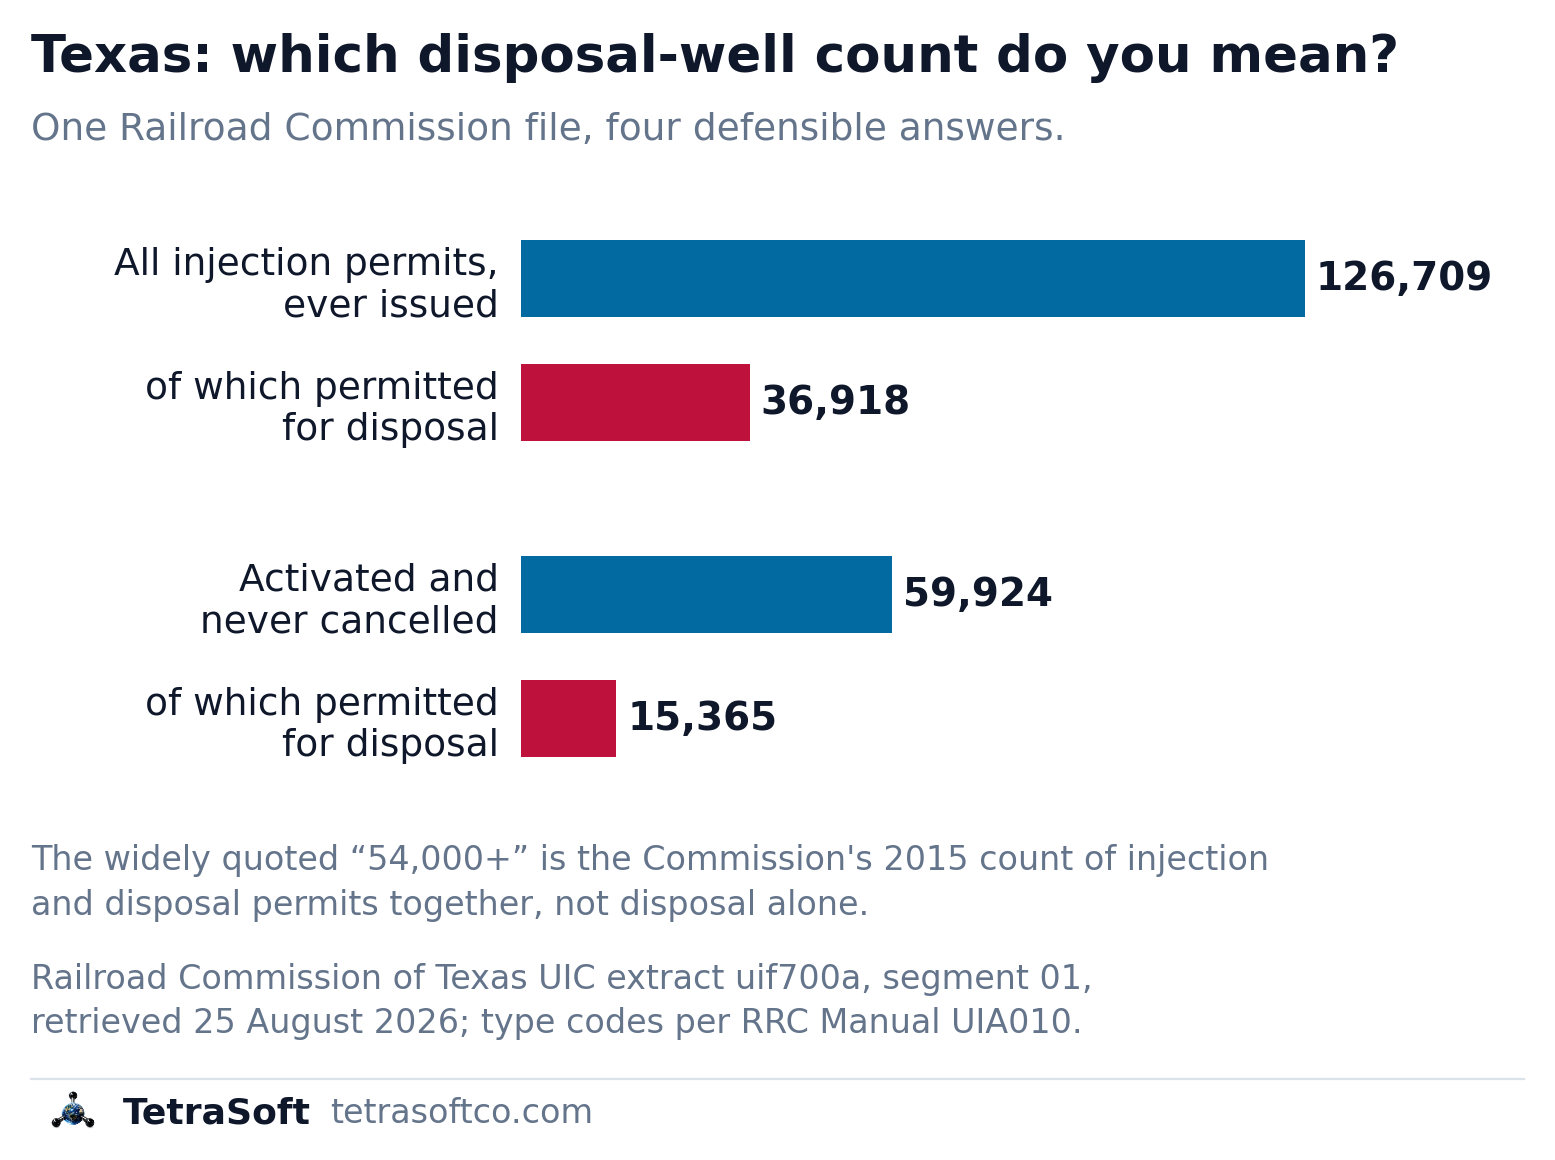
The same Railroad Commission file answers the disposal question four ways, depending on whether cancelled permits count [3].
What the States Actually Report
Seven states publish enough to separate disposal from enhanced recovery, and the results do not line up [2]. The disposal share ranges from under one percent to over a third [2].
| State | Disposal | Enhanced recovery | Total | Disposal share |
|---|---|---|---|---|
| Texas | 36,918 | 88,034 | 124,952 | 29.5% |
| Oklahoma | 5,662 | 10,780 | 16,442 | 34.4% |
| Pennsylvania | 27 | 14,582 | 14,609 | 0.2% |
| New Mexico | 1,798 | 6,104 | 7,902 | 22.8% |
| Wyoming | 504 | 3,865 | 4,369 | 11.5% |
| West Virginia | 122 | 1,923 | 2,045 | 6.0% |
| Colorado | 606 | 1,260 | 1,866 | 32.5% |
| Total | 45,637 | 126,548 | 172,185 | 26.5% |
Texas from the Railroad Commission UIC file; the other six from state agency well records [2]. Every total counts disposal and enhanced recovery only, which is why the Texas row reads 124,952 against the 126,709 permits in the file: 1,757 carry storage, miscellaneous, or a code the manual does not define [3].
A national figure exists, and it measures something different from the table above. EPA reports approximately 180,000 Class II wells in operation nationally, with disposal wells about 20 percent of them [1]. The two counts differ in three specific ways, and each one moves the number by itself.
The first difference is the measure: EPA counts wells in operation, while the table counts permits ever issued, including cancelled and plugged ones. Texas shows how much that one choice matters: 126,709 permits ever issued shrink to 59,924 when restricted to permits activated and never cancelled [3]. Measuring wells instead of permits roughly halves the largest state in the table.
The second difference is coverage, which pulls the opposite way: EPA’s count is national, the table’s seven states are not. So the near-match between 172,185 and 180,000 is coincidence, not agreement. The third difference is vintage: the EPA page attaches no year to its count. Every figure in the table, by contrast, carries an August 2026 retrieval date [2].
Texas is the only state here whose extract supports a comparison on EPA’s own basis. On the live count, its disposal share works out to 25.6 percent against the national 20. That residual gap is a real difference between Texas and the national average, measured on a like basis, rather than a bookkeeping artifact.
Reconciling seven agency vocabularies by hand is the slow part of this comparison.
Pennsylvania Barely Disposes At Home
One row in that table should stop a careful reader, though not for the reason it first suggests. Pennsylvania reports 27 disposal wells against 14,582 injection wells [2]. That is a disposal share of 0.2 percent, against 34.4 percent in Oklahoma.
The disposal count itself is sound, and the denominator is what distorts the ratio. Only 465 of those 14,582 injection wells are active, and 16 of the 27 disposal wells are [2]. The rest are plugged, abandoned, or were never drilled, most of them legacy waterflood wells in the northwestern oil fields [2]. On an active basis Pennsylvania’s disposal share is 3.3 percent rather than 0.2.
A low figure is still the right answer, because Pennsylvania mostly does not dispose of produced water in the ground. Since 2022 operators reported 115.5 million barrels reused at the well pad against 22.1 million barrels sent to injection wells [7]. Of that injected volume, 15.3 million barrels left the state and 6.7 million stayed, with Ohio taking almost all of the exported share [7]. Pennsylvania exports most of the disposal it does, which is why it needs so few wells of its own.
The Comparison Is the Finding
A table like the one above invites ranking, and ranking it would be a mistake. States with similar production report shares between 0.2 and 34 percent [2]. Three things drive that spread, and only one of them is disposal activity.
The first is vocabulary, and Texas separates disposal into two zone types before anyone asks [5]. Others publish one category and leave the split to the reader, who cannot recover it. The second is well-population age: a state counting a century of plugged wells reports a different ratio than one counting mostly live stock. The third is real practice, which is what remains once the other two are accounted for.
Where to Find Disposal Well Records
Every state in the table publishes its records, and none publishes them the same way. The table below links each agency’s public data portal, which is where every count in this post ultimately comes from.
| State | Agency | What the records look like |
|---|---|---|
| Texas | Railroad Commission of Texas | Fixed-width mainframe extract of the UIC database, bulk download |
| Oklahoma | Oklahoma Corporation Commission | Well data files and GIS map services |
| Pennsylvania | Department of Environmental Protection | Well inventories plus waste and disposal volume reports |
| New Mexico | Oil Conservation Division | Well files and bulk data through OCD Online |
| Wyoming | Oil and Gas Conservation Commission | Well records, downloads, and a map viewer |
| West Virginia | DEP Office of Oil and Gas | Permit and well datasets |
| Colorado | Energy and Carbon Management Commission | Database exports and GIS downloads |
*Each agency name links to its public records entry point. *
Reading the Texas File Is Harder Than It Looks
The Texas extract rewards care and punishes assumption. The injection type sits at a fixed byte position on the well master record [5]. The layouts shipped with the download cover only two of the record types, and the rest live in a separate manual [3].
Read the wrong two bytes and the field returns fragments of the well name, which look enough like type codes to be mistaken for them. Anyone parsing this file should validate a decoded field against its documented value distribution before trusting it.
TetraSoft Atlas Puts Seven States on One Map
Atlas was built for the assembly step this post describes. Disposal and injection wells from every state above appear on one map, filtered by type, with production and enforcement history on the same record. For the filed permit documents themselves, or a well’s specific injection authority, the state agency’s own imaging system remains the primary source.
The eight states in TetraSoft Atlas produced 68 percent of US crude oil and 83 percent of US marketed natural gas in 2025 [8]. Atlas is self-serve, with no sales call: you sign up and start a 7-day trial with no credit card [9].
Disposal volume and location also carry a seismic dimension in some basins, traced in Oklahoma Earthquake Map: 28,000 Events and What Drives Them. Pick a state in the lookup below for its disposal count and the agency file the number comes from.
Frequently Asked Questions
What is a saltwater disposal well?
It is a Class II injection well permitted to put produced water into a formation for permanent disposal [1]. The other main use of the class is enhanced recovery: a different well whose water pushes oil through a producing formation [1]. Texas separates the two on the permit itself, using distinct type codes for disposal and for secondary or tertiary recovery [5].
How many saltwater disposal wells are there in Texas?
The Railroad Commission’s UIC file carries 36,918 wells permitted for disposal [3]. That is drawn from 126,709 permitted injection wells in total, of which 88,034 are permitted for secondary or tertiary recovery [3]. Those counts span every permit ever issued, so they include cancelled and plugged wells [3]. Restricted to permits activated and never cancelled, the disposal figure is 15,365 [3].
Is every injection well a disposal well?
No, and in most states the majority are not [2]. Across the seven states here, 126,548 of 172,185 injection wells carry an enhanced recovery permit rather than a disposal permit [2]. Treating an injection well count as a disposal count overstates disposal roughly fourfold.
Why do states report such different disposal shares?
Three effects move the share, and only one is disposal practice. Oklahoma types 34.4 percent of its injection wells as disposal and Pennsylvania 0.2 percent [2]. Pennsylvania counts a century of plugged waterflood wells in that denominator, and it genuinely disposes very little at home [7].
Can I get disposal volumes as well as counts?
For some states, and not on the same terms. Texas reports injection volumes annually against each permitted well [3]. Counts and volumes answer different questions, and a state can publish one without the other.
References
- EPA Underground Injection Control Program, Class II wells. United States Environmental Protection Agency. https://www.epa.gov/uic/class-ii-oil-and-gas-related-injection-wells
- TetraSoft Atlas canonical well records, retrieved 25 August 2026. State agency well records for Oklahoma, New Mexico, Colorado, Wyoming, West Virginia, and Pennsylvania.
- Railroad Commission of Texas UIC database, retrieved 25 August 2026. Underground Injection Control data set (uif700a), Railroad Commission of Texas. https://www.rrc.texas.gov/resource-center/research/data-sets-available-for-download/
- EPA Underground Injection Control Program, well classes. United States Environmental Protection Agency. https://www.epa.gov/uic/underground-injection-control-well-classes
- Railroad Commission of Texas UIC Manual UIA010, injection type codes. Underground Injection Control magnetic tape user’s guide. https://rrc.texas.gov/media/v3onmigl/uic_manual_uia010_3116.pdf
- Railroad Commission of Texas injection and disposal wells FAQ. Injection and Disposal Wells FAQs, Railroad Commission of Texas. https://www.rrc.texas.gov/about-us/faqs/oil-gas-faq/injection-and-disposal-wells-faqs/
- Pennsylvania Department of Environmental Protection oil and gas waste reports, retrieved 25 August 2026. Oil and gas waste generation and disposal reports, Pennsylvania Department of Environmental Protection. https://www.pa.gov/agencies/dep/data-and-tools/reports/oil-and-gas-reports
- U.S. Energy Information Administration, crude oil field production and natural gas marketed production by state, annual 2025, accessed 23 September 2026. https://www.eia.gov/dnav/pet/pet_crd_crpdn_adc_mbbl_a.htm; https://www.eia.gov/dnav/ng/ng_prod_sum_a_EPG0_VGM_mmcf_a.htm
- TetraSoft Atlas landing page, accessed 24 September 2026. https://www.tetrasoftco.com/atlas-landing.html
Interactive tool
Saltwater disposal wells by state
How many of a state's injection wells are permitted for disposal rather than for pushing oil, and which record the number comes from.
Permitted for disposal in Texas
36,918
36,918 of Texas's 124,952 injection wells are permitted for disposal, 29.5% against 26.5% across the seven states.
- Disposal share of injection wells
- Permitted for enhanced recovery
- 88,034
- All injection wells
- 124,952
Where the record lives
Railroad Commission of Texas · UIC database extract (uif700a), segment 01
Permit injection-type code: 1 and 2 are disposal, 3 is enhanced recovery.
Counts every permit ever issued. Restricted to permits activated and never cancelled, disposal is 15,365 of 59,924.
Seven states, 172,185 injection wells, 45,637 permitted for disposal (26.5%). Texas from the Railroad Commission UIC extract; the other six from state agency well records. Retrieved 25 August 2026. Counts are permits on record, not wells currently injecting. Nothing leaves your browser.
Comments
0Share your thoughts. All comments are moderated before appearing.
No comments yet. Be the first to share your thoughts!