If you sell to, buy near or benchmark against Appalachian gas operators, a list with stale names sends you to the wrong company. Pennsylvania (PA), West Virginia (WV) and Ohio (OH) marketed an estimated 13.4 trillion cubic feet (Tcf) of gas in 2025, 31% of 43.2 Tcf nationally [1]. The figures come from the US Energy Information Administration (EIA), which collects, processes, analyzes and publishes US energy data [2]. Just twelve operator records account for 74% of the gas the three states’ wells reported for 2025 [3].
Sales teams, mineral buyers, service companies and analysts often ask two questions: who are the largest producers, and do they still run the wells? Here, a producer is the operator a state records for a well, sized by its wells’ gross 2025 gas; affiliated records stay separate [3]. Each well’s gas is credited to the operator on its current state record [3]. Names are the hard part: wells change hands, and each state spells the same company its own way.
A list built from one year’s filings can name a company that no longer runs the wells. Operator names below appear exactly as each state files them, abbreviations included [3]. OPER stands for Operating, PROD for Production and CO for Company; LLC marks a limited liability company and INC a corporation.
This guide answers both questions for those readers, starting with each state’s largest producer and a sortable table of the top operators. It then explains why one company appears under several names, how the ranking is built and how concentrated each state is. It ends with how to check a producer’s wells in TetraSoft Atlas, our subscription platform that maps state well records.
Quick Answer: By 2025 gas credited to each well’s current operator of record, Pennsylvania’s largest producer was EXPAND OPER LLC [3]. EXPAND OPER LLC’s total was 1,907.7 Bcf (billion cubic feet) [3]. West Virginia’s was ANTERO RESOURCES CORPORATION (1,455.6 Bcf), and Ohio’s was ASCENT RESOURCES UTICA LLC (851.1 Bcf) [3]. By 2025 filer instead, Pennsylvania’s leader was CHESAPEAKE APPALACHIA LLC (1,526.7 Bcf) [3].
Who Are the Largest Natural Gas Producers in Appalachia?
Credited to each well’s current operator, 2025’s largest producer in Pennsylvania was EXPAND OPER LLC [3]. West Virginia’s was ANTERO RESOURCES CORPORATION, and Ohio’s was ASCENT RESOURCES UTICA LLC [3]. Volumes are in Bcf, billion cubic feet, where one Bcf is one million Mcf, the thousand cubic feet unit West Virginia’s production file uses [4].
Company reports often quote gas in Bcf per day instead, usually net to the company’s own interest. EXPAND OPER LLC’s Pennsylvania total works out to about 5.2 Bcf per day, gross. State files record each well’s full volume under its operator, before partners’ and royalty owners’ shares, so the two will not match.
Pennsylvania wells reported 7,839.2 Bcf for 2025, and EXPAND OPER LLC’s 2,457 gas-reporting wells accounted for 24.3% of it [3]. In West Virginia, wells now under ANTERO RESOURCES CORPORATION reported 41.7% of the state’s 3,488.3 Bcf. [3] In Ohio, ASCENT RESOURCES UTICA LLC held 40.5% of 2,102.1 Bcf. [3]
EQT Corporation trades as EQT on the New York Stock Exchange [5]. CNX Resources Corporation trades there as CNX [6]. EOG Resources, Inc. trades as EOG on the same exchange [7]. COTERRA ENERGY INC has been a wholly owned subsidiary of Devon Energy since their merger closed on 7 May 2026 [8].
| State | Rank | Operator on the state well record | Gas, 2025 (Bcf) | Share of state |
|---|---|---|---|---|
| PA | 1 | EXPAND OPER LLC | 1,907.7 | 24.3% |
| PA | 2 | EQT PROD CO | 1,042.2 | 13.3% |
| PA | 3 | COTERRA ENERGY INC | 882.7 | 11.3% |
| PA | 4 | RANGE RESOURCES APPALACHIA LLC | 806.1 | 10.3% |
| PA | 5 | CNX GAS CO LLC | 519.0 | 6.6% |
| WV | 1 | ANTERO RESOURCES CORPORATION | 1,455.6 | 41.7% |
| WV | 2 | EQT PRODUCTION COMPANY, LLC | 802.4 | 23.0% |
| WV | 3 | EXPAND OPERATING LLC | 414.1 | 11.9% |
| WV | 4 | NORTHEAST NATURAL ENERGY LLC | 221.9 | 6.4% |
| WV | 5 | CNX GAS COMPANY LLC | 116.4 | 3.3% |
| OH | 1 | ASCENT RESOURCES UTICA LLC | 851.1 | 40.5% |
| OH | 2 | EOG Ohio, LLC | 374.3 | 17.8% |
| OH | 3 | GULFPORT APPALACHIA LLC | 363.7 | 17.3% |
| OH | 4 | Expand Operating LLC | 138.5 | 6.6% |
| OH | 5 | RICE DRILLING D LLC | 115.6 | 5.5% |
The five largest operator records in each state by gas reported to the Pennsylvania, West Virginia and Ohio regulators for 2025, credited to the operator on each well’s state record; names exactly as each state lists them. [3]
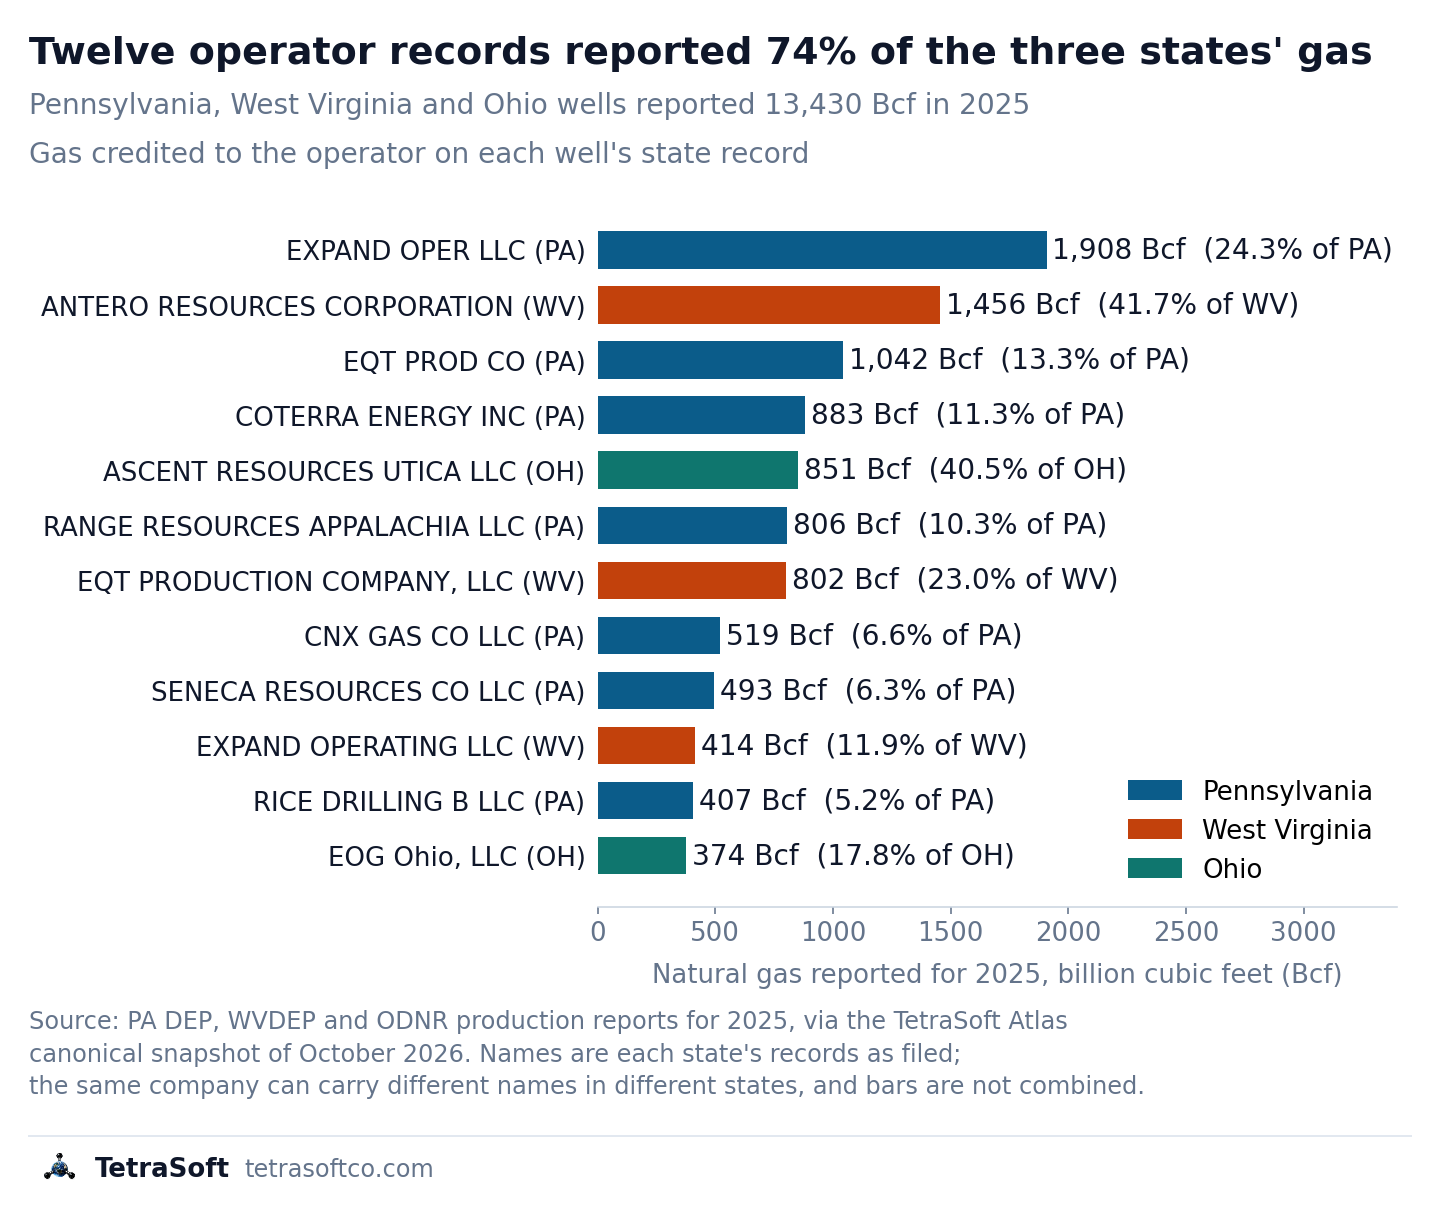
The chart shows the twelve largest operator records, 9,955.2 of the three states’ 13,429.6 Bcf (74%). [3] It adds two Pennsylvania records the table omits, SENECA RESOURCES CO LLC (493.4 Bcf) and RICE DRILLING B LLC (406.6 Bcf). [3]
Why Does One Company Appear Under Several Names?
Each state keeps its own operator names, so one business can appear as several records. Pennsylvania lists EXPAND OPER LLC, West Virginia EXPAND OPERATING LLC and Ohio Expand Operating LLC [3]. Added together, those three records total 2,460.3 Bcf, but no state file links them.
Pennsylvania lists EQT PROD CO and CNX GAS CO LLC [3]. West Virginia spells them EQT PRODUCTION COMPANY, LLC and CNX GAS COMPANY LLC [3]. Similar names also recur as separate records, such as RICE DRILLING B LLC in Pennsylvania and RICE DRILLING D LLC in Ohio [3]. EQT’s list of subsidiaries as of 31 December 2025, filed with the Securities and Exchange Commission, includes both [5].
Names also change over time, because the well record shows today’s operator while the 2025 filing shows who reported that year [3]. Pennsylvania’s 2025 filings for wells now under EXPAND OPER LLC mostly name CHESAPEAKE APPALACHIA LLC (1,526.7 Bcf) and SWN PROD CO LLC (374.8 Bcf) [3]. SWN was Southwestern Energy’s stock ticker, and Chesapeake and Southwestern closed their combination as Expand Energy on 1 October 2024 [9].
In Ohio, EAP OHIO LLC’s first-half 2025 statements reported 181.8 Bcf for wells now under EOG Ohio, LLC, which filed the other 192.5 Bcf. [3] EOG completed its acquisition of Encino Acquisition Partners (EAP), owner of producing Utica wells, on 1 August 2025 [7]. In West Virginia, HG ENERGY II APPALACHIA, LLC filed 265.0 Bcf in 2025 for wells now listed under ANTERO RESOURCES CORPORATION [3]. Antero completed its purchase of HG Energy II Production Holdings, LLC from HG Energy II LLC on 3 February 2026 [10].
How Is the Ranking Built From State Records?
The ranking adds up each well’s 2025 gas as reported to its state regulator, then credits it to the well record’s operator [3]. Calendar 2025 is the latest full year of reported production for Pennsylvania, West Virginia and Ohio in the October 2026 snapshot [3]. The three states collect production on different schedules, which is why a common year matters.
-
Pennsylvania: the Department of Environmental Protection (PA DEP), which regulates the state’s wells, publishes production as operators reported it in its production report [11]. Unconventional wells carry monthly volumes and conventional wells annual ones [12].
-
West Virginia: operators report production to the Department of Environmental Protection (WVDEP), the state’s oil and gas regulator, once a year by March 31 [4]. H6A wells, horizontal wells permitted under the Natural Gas Horizontal Well Control Act, West Virginia Code §22-6A, report quarterly instead [4]. Its yearly production file breaks each well’s gas out by month [4]. West Virginia’s Department of Environmental Protection (WVDEP) posts the quarterly H6A reports on the same page [4].
-
Ohio: under Ohio Revised Code 1509.11, the state law on production statements, owners of wells other than horizontal wells file an annual statement by March 31 [13]. Horizontal well owners file one for each quarter, on the 45th day after it closes [13].
Crediting the current operator ranks the companies that run the wells now, under the names each state’s well records show. The 2025 filer names still matter when a well changed hands, so the interactive table lists them beside the current name.
State files record what operators reported for each well, while EIA counts marketed production [1]. EIA defines that as gross withdrawals less gas used for repressuring, gas vented and flared, and nonhydrocarbon gases removed [1].
EIA’s 2025 marketed totals, 7,675.8 Bcf for Pennsylvania and 2,100.7 for Ohio, sit 2.1% and 0.1% below their state files of 7,839.2 and 2,102.1 [1]. West Virginia’s state file, 3,488.3 Bcf, is about 3% below EIA’s 3,600.0 Bcf, which EIA reports as both gross withdrawals and marketed production [1]. EIA’s table notes label its state production figures from 2021 forward as estimates, considered final once its Natural Gas Annual is published [1]. Shares in this guide are of each state’s own file, so West Virginia shares cover the reported volume, not all of the state’s gas.
Pick a state below and sort the table by any of its number columns.
How Concentrated Is Each State’s Gas Output?
West Virginia and Ohio are far more concentrated than Pennsylvania [3]. One operator record holds more than 40% of each of those two states, while Pennsylvania’s leader holds 24.3% [3]. Pennsylvania’s top five still reported 65.8% of its gas, from 847 operators credited with any [3].
By 2025 filer, the leaders held less: CHESAPEAKE APPALACHIA LLC 19.5% of Pennsylvania (1,526.7 Bcf) and ANTERO RESOURCES CORPORATION 34.1% of West Virginia (1,190.7 Bcf) [3]. The difference is wells whose current operator is not their 2025 filer, such as Chesapeake and SWN wells now under EXPAND OPER LLC. Crediting 2025 gas to today’s operators therefore shows more concentration than the filings do.
Well counts tell a different story from volumes. West Virginia’s well records list DIVERSIFIED PRODUCTION LLC as operator of 17,813 wells that reported 2025 gas, averaging 4.4 MMcf (million cubic feet) each [3]. The Pennsylvania record, DIVERSIFIED PROD LLC, shows 18,985 wells at 3.1 MMcf each, 360 unconventional, and the Ohio record 3,253 wells at 11.4 MMcf. [3] NORTHEAST NATURAL ENERGY LLC’s 166 wells averaged 1,336.9 MMcf, the highest per-well figure in West Virginia’s top ten [3].
That is a gap of about 300 times per well (1,336.9 MMcf against 4.4 MMcf), horizontal wells against mostly vertical ones. A list sorted by well count would put DIVERSIFIED PRODUCTION LLC first in West Virginia, though it ranks seventh by gas, with 78.7 Bcf. [3]
This post is for informational purposes only and does not constitute legal or compliance advice. Consult qualified legal counsel or a compliance professional for guidance specific to your operations and jurisdiction.
How Do You Check a Producer’s Wells in TetraSoft Atlas?
TetraSoft Atlas maps the Pennsylvania, West Virginia and Ohio wells behind these names, each with the operator on its state record [14].
Type an operator name into the operator search in TetraSoft Atlas and the Pennsylvania, West Virginia or Ohio map narrows to that operator’s wells [14]. Click a well in Atlas to open its production history, shown year by year in each state [14]. Each of the three states’ analysis views in Atlas ranks the top operators by gas produced over the life of their wells [14].
In the walkthrough below, DEP is Pennsylvania’s Department of Environmental Protection, the agency operators report each well’s production to [11].
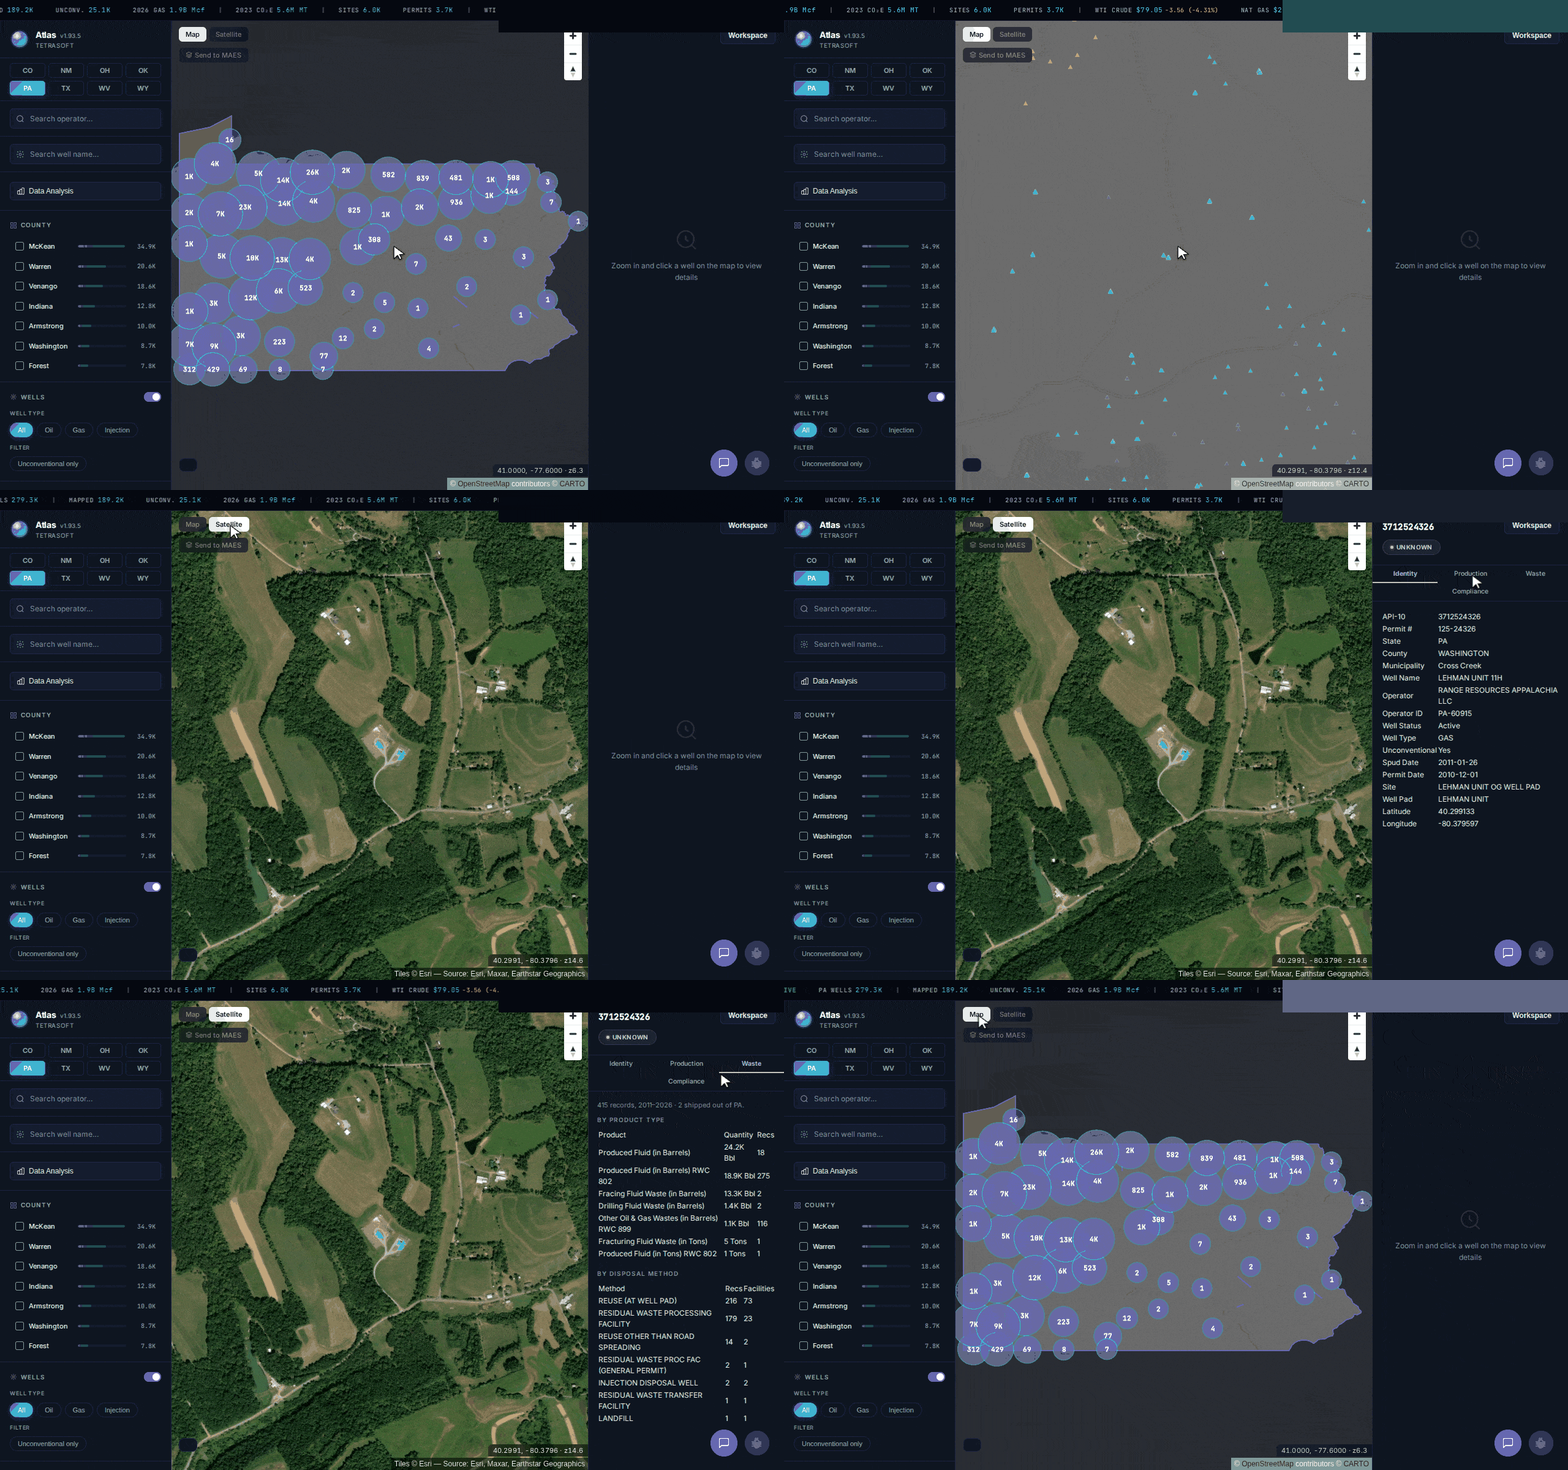
TetraSoft Atlas in Pennsylvania: from the statewide map to satellite view, then one unconventional well’s record, tab by tab.
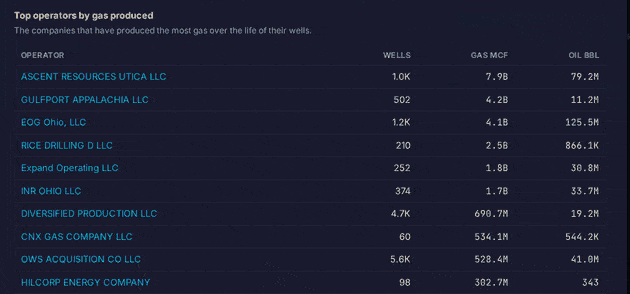
Ohio’s analysis view in TetraSoft Atlas ranks operators by lifetime gas, a longer window than this guide’s single year. [14]
Atlas keeps each state’s operator names as filed, so a company recorded under three spellings is searched under each [14].
Atlas covers eight states: Texas, New Mexico, Oklahoma, Colorado, Wyoming, Pennsylvania, West Virginia and Ohio [14]. By EIA’s 2025 estimates, those eight produced 68% of US crude (3.40 of 4.99 billion barrels) and 83% of marketed gas (35.8 of 43.2 Tcf) [1]. We plan to expand Atlas to every US state.
Atlas is scheduled to refresh every state at least monthly, and a state’s data can lag that schedule. A state’s new production reaches Atlas after that state publishes it, so an annual file such as WVDEP’s yearly production workbook arrives once a year.
The wider comparison of data platforms is in Oil and Gas Data Analytics Platforms: How to Choose One. For the state portals themselves, see PA DEP Oil and Gas Mapping Tool: How to Search Any PA Well, WVDEP Oil and Gas: Which Search Tool Answers Your Question and Ohio Gas Well Map: ODNR Wells With Production and Inspections.
Frequently Asked Questions
Which state produces the most natural gas?
Texas produces the most, with an estimated 12.66 trillion cubic feet (Tcf) of marketed gas in 2025, by EIA’s count [1]. In those EIA estimates, Pennsylvania was second at 7.68 Tcf, West Virginia fifth at 3.60 Tcf and Ohio seventh at 2.10 Tcf. [1] Together the three Appalachian states marketed an estimated 31% of US gas that year, 13.4 of 43.2 Tcf. [1]
Which Pennsylvania county produces the most natural gas?
Susquehanna County, whose wells reported about 1,370 Bcf for 2025, 18% of Pennsylvania’s 7,839.2 Bcf. [3] Bradford, Washington and Greene counties followed, each with more than 1,100 Bcf. [3] Reviewing 2022 data, EIA wrote that Susquehanna County has produced the most natural gas since 2014 [15].
Does the ranking include conventional wells?
Yes, every well with 2025 gas in the three state files counts, conventional or unconventional [3]. Pennsylvania’s 69,593 conventional wells reporting gas produced 66.8 Bcf, about 1% of the state’s 7,839.2 Bcf. [3] That is why an operator of many older wells can rank low by volume.
When will a 2026 ranking be possible?
Not before spring 2027. West Virginia operators of wells other than horizontal H6A wells report a year’s production to WVDEP by March 31 of the next year [4]. Ohio owners of wells other than horizontal wells file annual statements by March 31 [13].
How much does TetraSoft Atlas cost?
Atlas plans scale with the number of seats, and every listed plan starts with a 7-day free trial. The trial needs no credit card, and no sales call is required. For current plans and prices, see the Atlas pricing page.
You searched for the largest natural gas producers to learn who really produces the gas, and where. The state records name the operators; TetraSoft Atlas maps their Pennsylvania, West Virginia and Ohio wells, one state at a time, with each well’s production history [14].
References
- US Energy Information Administration, natural gas marketed production and crude oil field production by state, annual 2024 and 2025, accessed 27 October 2026. https://www.eia.gov/dnav/ng/ng_prod_sum_a_EPG0_VGM_mmcf_a.htm; https://www.eia.gov/dnav/ng/TblDefs/ng_prod_sum_tbldef2.asp; https://www.eia.gov/dnav/pet/pet_crd_crpdn_adc_mbbl_a.htm
- US Energy Information Administration, About EIA, read 2 November 2026. https://www.eia.gov/about/
- TetraSoft Atlas canonical snapshot of Pennsylvania, West Virginia and Ohio production and well records, October 2026. https://www.tetrasoftco.com/atlas-landing.html
- West Virginia DEP Office of Oil and Gas, Oil and Gas Production Data. https://dep.wv.gov/oil-and-gas/databaseinfo/Pages/default.aspx
- EQT Corporation, Form 10-K for the fiscal year ended 31 December 2025, SEC. https://www.sec.gov/Archives/edgar/data/33213/000003321326000018/eqt-20251231.htm
- CNX Resources Corporation, Form 10-K for the fiscal year ended 31 December 2025, SEC. https://www.sec.gov/Archives/edgar/data/1070412/000107041226000038/cnx-20251231.htm
- EOG Resources, Inc., Form 10-Q for the quarter ended 30 June 2025, SEC. https://www.sec.gov/Archives/edgar/data/821189/000082118925000070/eog-20250630.htm
- Coterra Energy Inc., Form 8-K, SEC, 7 May 2026. https://www.sec.gov/Archives/edgar/data/858470/000110465926057278/tm2613882d1_8k.htm
- Expand Energy Corporation, press release filed with the SEC as Exhibit 99.1 to Form 8-K, 1 October 2024. https://www.sec.gov/Archives/edgar/data/895126/000110465924104976/tm2425151d1_ex99-1.htm
- Antero Resources Corporation, Form 8-K/A, SEC, 17 April 2026. https://www.sec.gov/Archives/edgar/data/1433270/000110465926044934/tm2611828d1_8ka.htm
- Pennsylvania DEP Oil and Gas Well Production Report. https://greenport.pa.gov/ReportExtracts/OG/OilGasWellProdReport
- 25 Pa. Code §78a.121 and §78.121, production reporting. https://www.pacodeandbulletin.gov/Display/pacode?file=/secure/pacode/data/025/chapter78a/s78a.121.html
- Ohio Revised Code 1509.11, statement of production. https://codes.ohio.gov/ohio-revised-code/section-1509.11
- TetraSoft Atlas, eight-state oil and gas dataset read September 2026. https://www.tetrasoftco.com/atlas-landing.html
- US Energy Information Administration, Today in Energy, 2022 Appalachian natural gas production flat with productivity declines in key counties, 12 July 2023. https://www.eia.gov/todayinenergy/detail.php?id=57080
Interactive tool
Appalachian gas producers, 2025
Pick a state, then sort by any column to see which operators' wells reported the most natural gas to Pennsylvania, West Virginia and Ohio regulators in 2025.
Most gas reported, Pennsylvania, West Virginia and Ohio
EXPAND OPER LLC
Pennsylvania: 1,907.7 Bcf in 2025, 24.3% of the state's gas, from 2,457 wells (776.4 MMcf per well)
- Gas reported, 2025
- 13,429.6 Bcf
- Wells reporting gas
- 165,852
- Operators credited
- 1,849
- Held by rows shown
- 91.6%
Choose Pennsylvania, West Virginia, Ohio or all three.
| # | Operator (state record) | ||||
|---|---|---|---|---|---|
| 1 | EXPAND OPER LLC | 1,907.7 | 24.3% | 2,457 | 776.4 |
| 2 | ANTERO RESOURCES CORPORATION | 1,455.6 | 41.7% | 1,650 | 882.2 |
| 3 | EQT PROD CO | 1,042.2 | 13.3% | 1,159 | 899.2 |
| 4 | COTERRA ENERGY INC | 882.7 | 11.3% | 1,116 | 790.9 |
| 5 | ASCENT RESOURCES UTICA LLC | 851.1 | 40.5% | 981 | 867.5 |
| 6 | RANGE RESOURCES APPALACHIA LLC | 806.1 | 10.3% | 1,625 | 496.1 |
| 7 | EQT PRODUCTION COMPANY, LLC | 802.4 | 23.0% | 1,054 | 761.3 |
| 8 | CNX GAS CO LLC | 519.0 | 6.6% | 600 | 865.0 |
| 9 | SENECA RESOURCES CO LLC | 493.4 | 6.3% | 1,036 | 476.2 |
| 10 | EXPAND OPERATING LLC | 414.1 | 11.9% | 729 | 568.0 |
| 11 | RICE DRILLING B LLC | 406.6 | 5.2% | 631 | 644.4 |
| 12 | EOG Ohio, LLC | 374.3 | 17.8% | 1,146 | 326.6 |
| 13 | GULFPORT APPALACHIA LLC | 363.7 | 17.3% | 494 | 736.3 |
| 14 | REPSOL OIL & GAS USA LLC | 333.1 | 4.2% | 792 | 420.5 |
| 15 | EQT ARO LLC | 259.0 | 3.3% | 433 | 598.1 |
| 16 | PENNENERGY RESOURCES LLC | 231.6 | 3.0% | 459 | 504.6 |
| 17 | NORTHEAST NATURAL ENERGY LLC | 221.9 | 6.4% | 166 | 1,336.9 |
| 18 | Expand Operating LLC | 138.5 | 6.6% | 249 | 556.2 |
| 19 | CNX GAS COMPANY LLC | 116.4 | 3.3% | 101 | 1,152.6 |
| 20 | RICE DRILLING D LLC | 115.6 | 5.5% | 203 | 569.6 |
| 21 | ARSENAL RESOURCES LLC | 88.0 | 2.5% | 128 | 687.8 |
| 22 | INR OHIO LLC | 86.1 | 4.1% | 368 | 233.9 |
| 23 | DIVERSIFIED PRODUCTION LLC | 78.7 | 2.3% | 17,813 | 4.4 |
| 24 | JAY-BEE OIL & GAS, INC. | 67.2 | 1.9% | 540 | 124.4 |
| 25 | VICKERY ENERGY, LLC | 54.3 | 1.6% | 147 | 369.5 |
| 26 | HILCORP ENERGY COMPANY | 50.9 | 2.4% | 95 | 535.9 |
| 27 | EOG RESOURCES INC. | 44.0 | 2.1% | 84 | 524.3 |
| 28 | EQT CHAP LLC | 39.2 | 1.1% | 97 | 404.1 |
| 29 | DIVERSIFIED PRODUCTION LLC | 37.1 | 1.8% | 3,253 | 11.4 |
| 30 | CNX GAS COMPANY LLC | 14.3 | 0.7% | 46 | 311.2 |
Share of state is the operator's part of its own state's 2025 total. "2025 filings" names the filer where the state's 2025 production file records a different name than today's well record. The same company can appear under different names in different states, and the table does not combine them. Gas reported to PA DEP, WVDEP and ODNR for calendar 2025, credited to the operator on each well's state record, from the TetraSoft Atlas canonical snapshot of October 2026. Names are each state's records as filed, not corporate groups.
Comments
0Share your thoughts. All comments are moderated before appearing.
No comments yet. Be the first to share your thoughts!