Land screens, acquisition reviews and emissions reports all start from the same public well records, and many teams pay a platform to read them. The wrong choice rarely shows in the demo; it shows a month later, when your state turns out thin or a count will not reproduce. This guide covers US onshore well, production and emissions data for analysts, operators and consultants who are choosing a platform now.
The guide compares the five kinds of platform and says what each one leaves you to do yourself. Then it shows how to test a shortlist in a trial.
We build one of the platforms in this comparison: TetraSoft Atlas, our subscription platform that brings public well, production, emissions and enforcement records onto one map. We say where it fits, and name the jobs it is not built for.
Quick Answer: The best oil and gas data analytics platform is the kind built for your states and your job. Enterprise suites fit national teams with enterprise budgets, and lookup platforms fit quick checks of single wells. Free portals fit a few wells checked at the source. For cross-state screens in the eight states that together produce most US oil and gas, TetraSoft Atlas is built for the job. Whichever you shortlist, test it on 20 wells you already know, in a free trial or a live demo.
In this guide:
- What an Oil and Gas Data Analytics Platform Actually Does
- Five Kinds of Oil and Gas Data Platform Compared
- What Each Kind Leaves You to Do Yourself
- How to Test a Platform Before You Subscribe
- Why TetraSoft Atlas Fits Multi-State Work
What an Oil and Gas Data Analytics Platform Actually Does
A platform’s real job is conversion: turning dozens of agency files into one consistent dataset you can search, map and compare. Producing states publish their well records, much of it free of charge, and each does it in its own files, fields and schedule.
Texas is the example used here, because it produced 42 percent of US crude oil in 2025, more than any other state [1]. Its regulator also puts the division of labor in writing. The Railroad Commission of Texas download page states: “The conversion of the data and choice of conversion tools is the responsibility of the user.” [2]
Every Layer Hangs Off One Well Identity
Converting the files is half the job; the other half is the join, which links every record describing one well through a shared key. That key is the API number, the well identifier state regulators assign, explained in the API Well Number Lookup: What It Is and How to Read One post. The figure shows the four layers a platform hangs on that identity. Location depends on a datum, the reference model of the earth that coordinates are measured against, and bottomhole means where the wellbore ends underground.
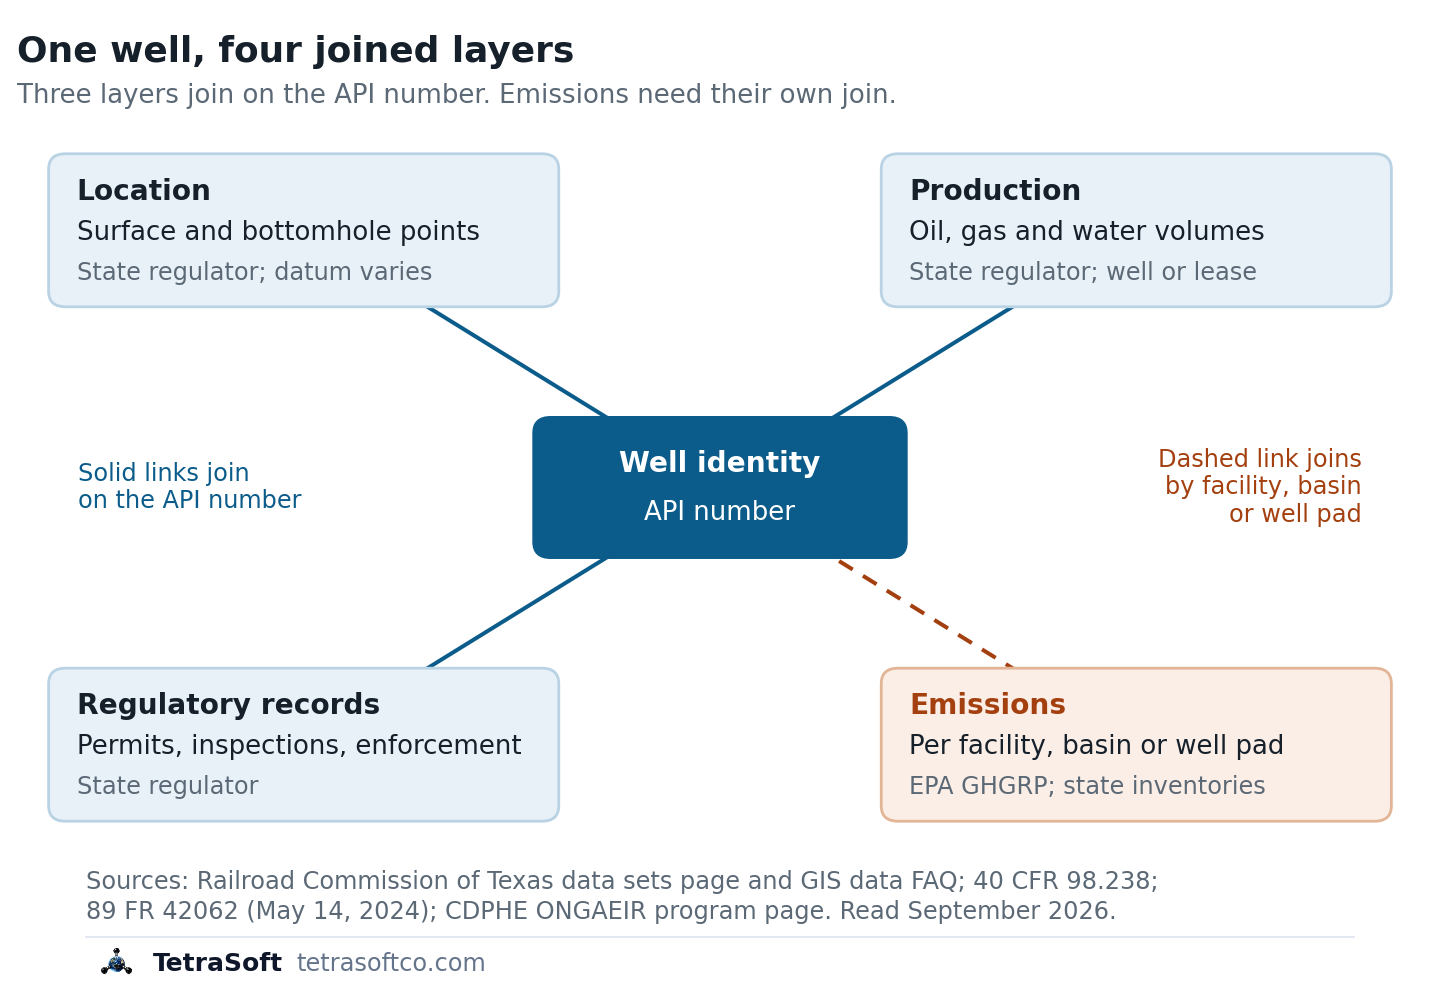
Location and regulatory records join on the API number, and production does wherever the state reports it per well (Texas reports it per lease); emissions arrive mostly per facility, basin or well pad, so they need their own join.
The dashed emissions link is the join to ask every vendor about. Emissions come from the Greenhouse Gas Reporting Program (GHGRP), EPA’s federal program, and from state inventories. Federal Subpart W reports group an operator’s onshore production equipment into facilities that can span a whole basin.
A platform that shows emissions beside wells has done a join that the federal program makes for five well-related source types, from reporting year 2025. The rest of onshore production is reported per well-pad from reporting year 2025, and per basin-wide facility or sub-basin before that.
Five Kinds of Oil and Gas Data Platform Compared
Oil and gas data platforms fall into five kinds, and the right one depends on your states and what you do with the data. The table compares the kinds, with one or two example vendors per kind, from vendor websites read on September 29, 2026. The last column is our opinion of what to check in each kind, not a finding about any vendor.
| Kind of platform | Example | Built for | Price model on the vendor’s own site | What to check (our opinion) |
|---|---|---|---|---|
| Enterprise energy suite | Enverus | Land, finance, operations and trading teams | No subscription price on the homepage; a Get Started form | Which states and modules your contract covers |
| Analytics and forecasting | Novi Labs | Development planning and asset valuation | No price on the homepage; a live demo request | Which well data each forecast is fitted on |
| Well-data lookup platform | WellDatabase, DrillingEdge | Well search, mapping and reporting | Published plans, including a free WellDatabase tier and DrillingEdge plans by county, state or nationwide | Your own state’s well count and which fields come back filled |
| State regulator portal | Railroad Commission of Texas | Checking one record at its source | Free | How long converting and joining the raw files takes you, one state at a time |
| Multi-state public-record platform | TetraSoft Atlas | Cross-state screens in eight major producing states, self-serve | Monthly subscription, 7-day free trial | Whether your wells sit in its eight states, since wells elsewhere need another kind |
Price models for each vendor’s main platform as its own website presented them on September 29, 2026 (Enverus also lists prices for some map products in its online store); check each vendor’s site for current terms.
WellDatabase’s pricing page lists a free Lite plan [3]. DrillingEdge’s pricing page offers County Access, Statewide Access and Nationwide Access plans [4].
The example vendors describe themselves in their own terms, which are claims to test rather than findings.
-
Enverus’s homepage says it is “trusted by 8,000+ companies” [5].
-
Novi Labs’ homepage lists “AI-powered production forecasting” and “Comprehensive well-level data” among its products [6].
-
WellDatabase’s homepage describes its coverage as “Every well ever drilled in the US and Western Canada.” [7]
-
DrillingEdge’s homepage states that “All data is now updated weekly instead of our old monthly schedule” [8].
What Each Kind Leaves You to Do Yourself
Each kind of platform leaves some share of the conversion and join to you. The useful question is which part you will be doing on a Friday afternoon, not which logo is biggest.
Free Sources Cost Analyst Time Instead of Money
Free can cost more than a subscription once you need more than a few wells. The Texas regulator offers its full wellbore file in ASCII and in EBCDIC, an old IBM text format, as raw files for you to decode [2]. Its map data uses the North American Datum of 1927 (NAD27) [9].
USGS puts the NAD27 to NAD83 shift of latitude and longitude “in the range of 10-100 ground meters” within the conterminous 48 states [10]. Converting wells from mixed datums to one datum is part of the job a free file leaves you. Now repeat that for every state you work in, on every refresh. If you still want to see a state’s own records first, our guides walk through each portal, starting with the RRC Wellbore Query: How to Search Texas Well Records Online.
Paid Platforms Still Leave Checks to You
In our opinion, any paid platform leaves you a few checks that its demo will not run for you. With a broad suite, confirm that the states and modules you pay for match the states you work in. With any forecast, audit the well data it was fitted on, because a forecast inherits errors in its inputs.
With any national total, ask for the count in your own county, because a total can hide thin coverage in one place. Ask any paid kind to show emissions beside a well, and to name the program and grain behind each figure.
Multi-state public-record platforms take a narrower scope: fewer states than a national suite, with well records joined and traced to their agency. TetraSoft Atlas is our product in this kind. Its eight states produced 68 percent of US crude oil and 83 percent of US marketed gas in 2025 [1]. They include Texas and New Mexico, the two largest oil producers, and Pennsylvania, the second-largest gas producer [1].
Atlas needs no sales call: you sign up yourself and start a 7-day trial with no credit card [11]. Wells outside the eight states need a national kind, and the checker below routes you there.
Which Kind of Platform Fits Your Work?
The checker matches where your wells are, what you need the data for and your budget to one kind from the table.
How to Test a Platform Before You Subscribe
A free trial is most useful when you spend it testing your own wells, not browsing the vendor’s demo set. Pick 20 wells you already know, then ask the vendor to show each of these six on screen.
| Test | Ask to see | Red flag |
|---|---|---|
| 1. Coverage unit | The count for your state, and the unit it counts in | A count whose unit the vendor cannot name |
| 2. Freshness | Each state’s snapshot date | No dates, or a date no agency schedule could produce |
| 3. Provenance | The agency and file behind a field | ”Our proprietary data” for a public record |
| 4. Joins | One API number with its production (or its lease’s, where the state reports by lease), permits and inspections | Records that do not line up for one well |
| 5. Emissions grain | Which program reported a figure, and for what unit | A basin total shown as one well’s emissions |
| 6. Cross-state consistency | One filter run in two of your states | A field that means different things per state |
Counts and Dates Decide Whether a Number Holds
Test one is the coverage unit. One state can be counted as well records, completion records or distinct wellbores, and the three totals differ. A wellbore is one drilled hole, and a completion is one interval of it opened to produce. Ask which unit a count uses before you compare it with another platform’s.
Tests two and three are freshness and provenance. The Texas regulator publishes its full wellbore file weekly and its drilling-permit files on schedules from twice daily to monthly, and no platform can be fresher than the agency file it converts [2]. Every field should trace to a named agency and a date, so a disputed number can be checked at its source.
Joins and Emissions Decide Whether the Data Works
Test four is the join. Follow one well across production, permits and inspections; each record should link to that well, by API number or, where the state reports production by lease, through its lease.
Test five is the emissions grain, meaning the unit a figure is reported for: a component, a well pad, a facility or a basin. Where an operator runs several wells in a basin, Subpart W of 40 CFR Part 98 treats equipment “associated with all wells that the person or entity owns or operates in the basin” as one facility [12].
The federal rule is in flux, so the next three sentences state its status as of October 27, 2026. EPA’s May 2024 amendments require onshore production operators to report some emissions data for “each individual well” from reporting year 2025 [13]. A September 2025 proposal would suspend Subpart W reporting, including that well-level reporting, until reporting year 2034 [14]. The proposal is not final; EPA has instead moved the 2025 reporting deadline twice, to October 30, 2026 and then, in an October 14, 2026 interim final rule, to March 10, 2027 [15] [18].
The GHGRP Subpart W Reporting in 2026: What Is Still Required post tracks the rule. State inventories keep reporting either way, as the What Is Subpart W Suspension? State Rules Still Apply post explains. Colorado’s Oil and Natural Gas Annual Emission Inventory Reporting program, ONGAEIR, is run by the state health department’s Air Pollution Control Division [16]. A platform worth paying for keeps each program named, at the grain it reported, rather than blending them into one number.
Test six is the same filter in two states, because a status such as “inactive” can mean different things in different agencies’ files. A vendor who answers all six on screen has earned a longer trial; one who answers with a roadmap has told you what the product does not do yet.
Run the six requests on TetraSoft Atlas across eight states during a seven-day trial.
Why TetraSoft Atlas Fits Multi-State Work
Your screen breaks twice: the conversion Texas leaves to you, and onshore Subpart W emissions, reported per well only for five well-related source types. TetraSoft Atlas is built around both. Atlas converts eight states onto one well identity, and maps each emissions reporter near the wells around it, labeled with its program. Your analysts start from a joined record instead of a download folder.
Looking for an Enverus Alternative?
TetraSoft Atlas is an Enverus alternative for one job: the regulator record for the wells in its eight states. Enverus’s homepage lists no subscription prices, and its Get Started form says: “We’ll follow up right away to show you a quick product tour.” [5] The same homepage describes workflows across land, finance, operations, trading and power [5]. In our opinion, many screens, reviews and reports need only the regulator record, which is the job Atlas is built for.
The eight states are Texas, New Mexico, Oklahoma, Colorado, Wyoming, Pennsylvania, West Virginia and Ohio, and we are expanding Atlas to every US state [11]. Atlas puts wells, production, permits, inspections, enforcement and emissions records on one map, and the layers vary by state. In Atlas, Oklahoma carries well records, drilling permits, injection volumes and earthquakes, but not yet the state’s production or well-incident records.
Monthly plans are listed on the pricing page, and you start the 7-day trial yourself, with no credit card [11]. Test it against any platform you are weighing on the same 20 wells, using the six tests in this guide.
TetraSoft Atlas Covers Eight States and 2.8 Million Well Records
Those eight states hold about 2.8 million well records in Atlas, and the table lists the count and source agency for each [17]. Atlas is scheduled to refresh every state at least monthly, though a state’s data can lag its schedule [11].
| State | Source agency | Well records in Atlas | Our guide |
|---|---|---|---|
| Texas | Railroad Commission of Texas (RRC) | 1,213,035 | RRC Wellbore Query |
| Oklahoma | Oklahoma Corporation Commission (OCC) | 455,962 | OCC Oklahoma Oil and Gas |
| Pennsylvania | Department of Environmental Protection (DEP) | 279,541 | PA DEP Oil and Gas Mapping |
| Ohio | Department of Natural Resources (ODNR) | 242,399 | ODNR Well Locator |
| West Virginia | Department of Environmental Protection (WVDEP) | 167,465 | WVDEP Oil and Gas |
| New Mexico | Oil Conservation Division (OCD) | 142,393 | NMOCD Well Search |
| Colorado | Energy and Carbon Management Commission (ECMC) | 124,558 | COGCC (Now ECMC) Oil and Gas Data |
| Wyoming | Oil and Gas Conservation Commission (WOGCC) | 130,877 | WOGCC Well Search |
Well records per state in TetraSoft Atlas on 30 September 2026, 2,756,230 in total, each state counted in its own agency’s unit. Texas counts RRC well records, one per API number. Colorado counts the ECMC well register plus wells linked to ONGAEIR reports. Wyoming counts the WOGCC Active Wells layer plus the agency’s plugged-and-abandoned wells, so it includes permitted, shut-in, producing and plugged wells. The other five states count the well records in each agency’s well data. [17]
One Well in TetraSoft Atlas, Traced to Its Agency
TetraSoft Atlas puts a well’s identity, production history and inspections under one API number, with the operator, lease and spud date on the first tab. The screenshot shows that joined record for one producing Texas well in Jasper County. The Railroad Commission reports production by lease, so a Texas well’s volumes in Atlas are its lease total split evenly across the lease’s wells.
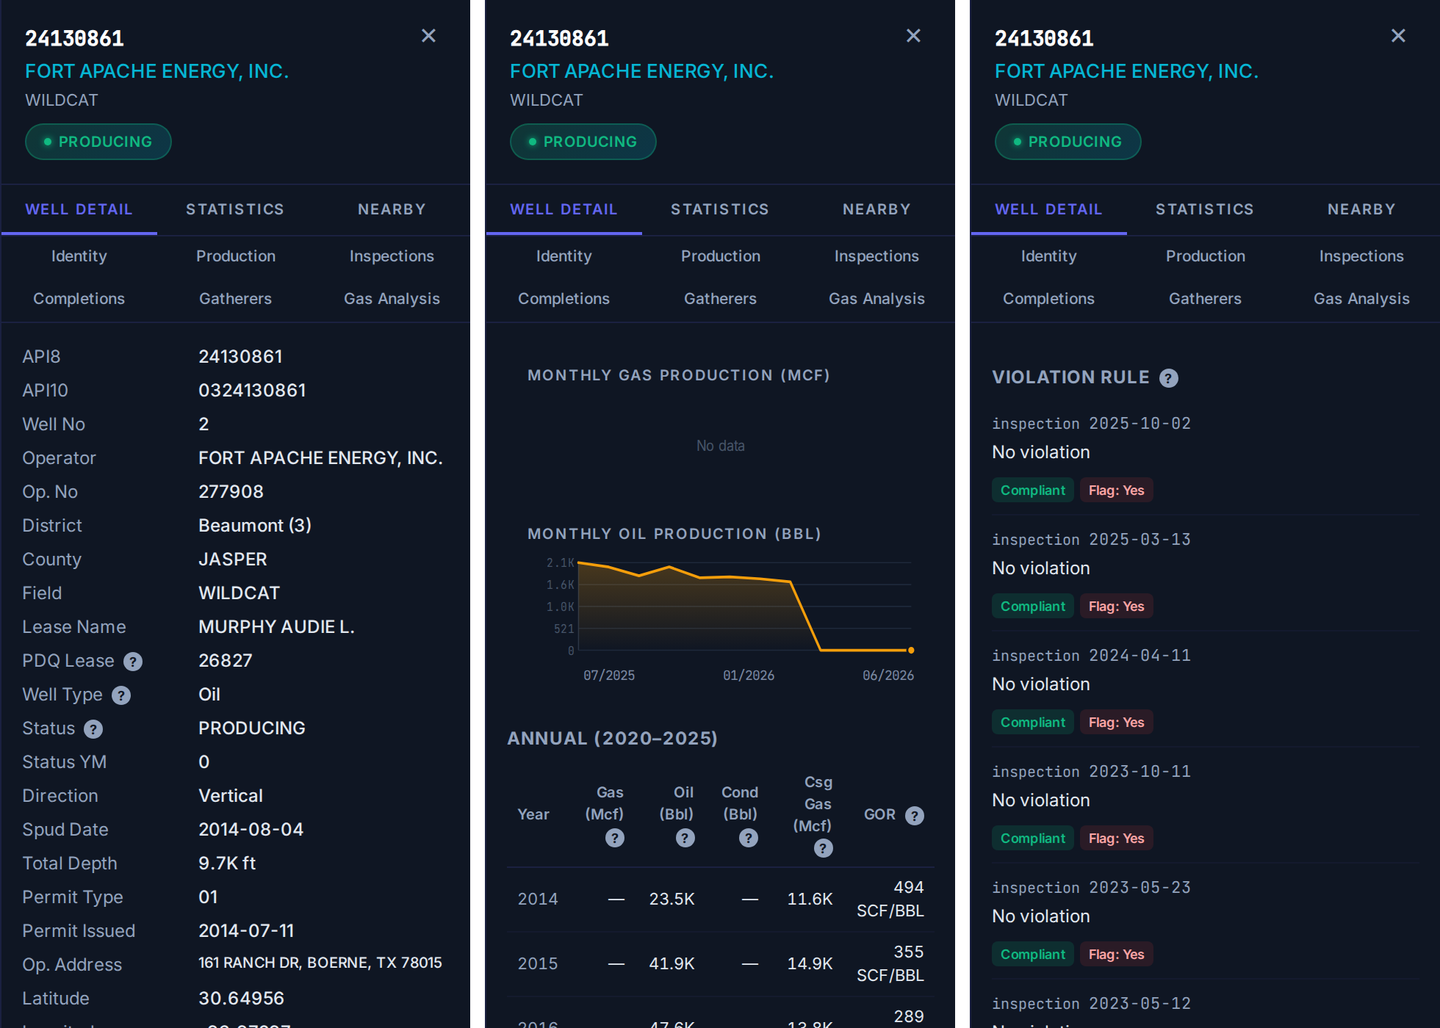
One Texas well in TetraSoft Atlas: identity, lease-split production and inspections from Railroad Commission of Texas records, captured September 2026.
Atlas does not replace a national suite for a team whose wells span every basin, and it does not forecast production. For a team working in some of these eight states, it replaces the download folder, the conversion scripts and the spreadsheet join. Every listed plan starts with a free 7-day trial, and no credit card is required [11]. Open the 20 wells you know on day one, and run the six tests before you pay.
Frequently Asked Questions
What is the best oil and gas data platform?
The best platform depends on your states and your job. For cross-state screens in the eight states that together produce most US oil and gas, TetraSoft Atlas is built for the job. It puts each state’s agency records on one map, so you skip converting and joining the files yourself. Shortlist by kind with the platform-fit checker in this guide, then test 20 of your own wells in a free trial or a live demo.
How much does oil and gas data cost?
Oil and gas data runs from free to enterprise contracts, and you pay mainly for conversion and joins. Regulator portals such as the Texas one are free, but you convert and join the agency files yourself, state by state.
The lookup vendors named here publish their plans. The Enverus and Novi Labs homepages show no prices and offer a product tour or a live demo. Budget for the analyst time a free source costs as well as the license a paid one costs.
Is oil and gas well data public?
Yes, well records in US producing states are public, and the state regulator is the official source. The Texas regulator’s page opens: “The following data sets are available from the Railroad Commission of Texas at free of charge.” [2] What is not public-ready is the format, since each agency publishes its own files and schema.
Is there a national oil and gas well database?
No single agency keeps a current well-by-well register for every state; well records are kept by various regulatory agencies, mainly each state’s regulator. The Bureau of Land Management also permits wells on federal leases.
A national database is therefore an aggregation of state files, such as the ones commercial platforms compile from agency records. When a platform claims national coverage, test it on the state you care most about. Ask for that state’s well count, unit and snapshot date.
How often is oil and gas production data updated?
Production reporting schedules vary by state. Texas operators report production to the Railroad Commission monthly. Ohio and West Virginia collect production annually from most wells, and quarterly from horizontal wells.
Texas, for example, refreshes its full wellbore file weekly and its drilling-permit files on schedules from twice daily to monthly [2]. A platform’s agency-sourced records cannot be fresher than the agency’s files, so the useful number is the snapshot date shown for each state.
Who are the main oil and gas data providers?
The main providers fall into the five kinds in the comparison table, each with a few recognized names. This guide uses Enverus as its example of an enterprise energy suite, and Novi Labs as its example of analytics and forecasting. WellDatabase and DrillingEdge publish subscription plans for well data on their pricing pages. State regulators remain the official source, and TetraSoft Atlas joins eight states’ records in one view.
How much does Enverus cost?
Enverus does not list subscription prices on its homepage, so ask Enverus for a quote. Its Get Started form says: “We’ll follow up right away to show you a quick product tour.” [5] TetraSoft Atlas lists its monthly plans on its pricing page [11]. Every listed Atlas plan starts with a 7-day free trial [11].
What is a good Enverus alternative?
A good alternative covers your states well by well and tells you how often each state is refreshed. It should also let you test your own wells before you pay. TetraSoft Atlas covers the eight states in this guide from each state agency’s records, and is scheduled to refresh every state at least monthly [11]. Its 7-day trial starts without a credit card [11].
This post is for informational purposes only and does not constitute legal or compliance advice. Consult qualified legal counsel or a compliance professional for guidance specific to your operations and jurisdiction.
Enverus, Novi Labs, WellDatabase and DrillingEdge are trademarks of their respective owners. The comparison reflects each vendor’s public website as of September 29, 2026, and TetraSoft is not affiliated with or endorsed by any vendor named here.
References
- U.S. Energy Information Administration, crude oil and natural gas marketed production by state, annual 2025, accessed September 23, 2026
- Railroad Commission of Texas, Data Sets Available for Download, accessed September 22, 2026
- WellDatabase, Plans and Pricing, welldatabase.com/pricing, accessed September 29, 2026
- DrillingEdge plans and pricing page, drillingedge.com/pricing, accessed September 29, 2026
- Enverus homepage, enverus.com, accessed September 29, 2026
- Novi Labs homepage, novilabs.com, accessed September 29, 2026
- WellDatabase homepage, welldatabase.com, accessed September 29, 2026
- DrillingEdge homepage, drillingedge.com, accessed September 29, 2026
- Railroad Commission of Texas, Digital Map Information GIS Data FAQ, accessed September 22, 2026
- U.S. Geological Survey, How large is the North American Datum of 1927 (NAD 27) to NAD 83 shift?, accessed September 23, 2026
- TetraSoft Atlas landing page, tetrasoftco.com/atlas-landing.html, accessed September 28, 2026
- 40 CFR 98.238, Definitions, Subpart W (Petroleum and Natural Gas Systems)
- 89 FR 42062, Greenhouse Gas Reporting Rule: Revisions and Confidentiality Determinations for Petroleum and Natural Gas Systems, May 14, 2024
- 90 FR 44591, Reconsideration of the Greenhouse Gas Reporting Program, proposed rule, September 16, 2025
- 91 FR 9712, Extending the Reporting Deadline Under the Greenhouse Gas Reporting Rule for 2025, February 27, 2026
- Colorado Department of Public Health and Environment, ONGAEIR program page, accessed September 23, 2026
- TetraSoft Atlas, per-state well counts read 30 September 2026
- 91 FR 65112, Extending the Reporting Deadline Under the Greenhouse Gas Reporting Rule for Reporting Year 2025 to March 10, 2027, interim final rule, October 14, 2026
Interactive tool
Which kind of data platform fits?
Tell it where your wells are, what you need the data for, and what you can spend. It returns the kind of platform to trial first, and the test to run on it.
Trial first
Well-data lookup platform
For example: WellDatabase or DrillingEdge
- Wells outside a regional footprint need national coverage, which the lookup platforms offer.
- Check: Your own state's well count and which fields come back filled.
First test to run
Look up 20 of your own wells and count the fields that come back empty.
Platform kinds as grouped in this post from each vendor's own website, read September 29, 2026. It recommends a kind of platform; the vendor shown is only an example. We make TetraSoft Atlas, and it is only suggested when every well you name sits in one of its eight states.
Comments
0Share your thoughts. All comments are moderated before appearing.
No comments yet. Be the first to share your thoughts!