Natural gas liquids are the hydrocarbons heavier than methane that travel in a gas stream and drop out as liquid at the surface. The group runs from ethane through propane and the butanes to the pentanes and a heavier tail [1]. Their share of a stream is measured as GPM, the gallons of recoverable liquid carried in one thousand cubic feet of gas.
National and state statistics report what gas plants produced, which is a different question from what a given well produces. Measured analyses from eight states sit beside their wells in TetraSoft Atlas, our subscription platform joining well, production, emissions and enforcement records [2].
Quick Answer: Natural gas liquids are ethane, propane, the butanes, the pentanes and a heavier tail carried in natural gas [1]. Content is measured as GPM, and across 8,882 screened well analyses in eight states the state medians run from 1.13 to 3.02 gallons per Mcf. [2] Those analyses sit against their wells in TetraSoft Atlas, where a subscriber can open any one of them [2]. Within a single state the fifth to ninety-fifth percentile span is four to thirty-nine times wide, so a state average does not describe a well [2].
What Natural Gas Liquids Are, and Where They Leave the Stream
NGLs are individual chemical compounds, not a single substance with one price or one property. A gas analysis resolves them separately up to the pentanes and groups everything heavier into one bucket [2]. That grouping is why the heaviest fraction appears on a chromatography sheet as hexanes-plus rather than as named compounds.
| Component | Symbol | Main uses |
|---|---|---|
| Ethane | C2 | Ethylene feedstock; fuel for power generation |
| Propane | C3 | Space, water and crop-drying heat; transport fuel; petrochemical feedstock |
| Isobutane | iC4 | Alkylate for gasoline octane; refrigerant; isomerised from normal butane |
| Normal butane | nC4 | Gasoline blending; petrochemical feedstock; isomerised into isobutane |
| Isopentane | iC5 | Motor gasoline blending; fuel ethanol denaturant; heavy-crude diluent |
| Normal pentane | nC5 | Motor gasoline blending; fuel ethanol denaturant; heavy-crude diluent |
| Hexanes-plus | C6+ | Motor gasoline blending; fuel ethanol denaturant; heavy-crude diluent |
Uses as EIA describes them. The three heaviest rows share one entry because EIA groups pentanes and heavier as natural gasoline, or pentanes plus, rather than by individual compound. [3]
Two separations decide which barrel a molecule ends up in. The wellsite separator drops out the heaviest material at lease conditions, and that liquid is measured and sold as condensate. Everything still in the vapour leaving the separator travels to a gas processing plant, where a fractionation train splits it into the products above.
Recovery is an economic choice rather than a fixed process. Ethane is the clearest case, because leaving it in the residue gas sells it as heating value instead of as feedstock. The recovered volumes move on the same midstream systems as the residue gas, which a Natural Gas Pipeline Map: Lines, Operators, and Safety shows for the transmission side.
Ethane Is Most of the Barrel
A single component dominates the recoverable liquid, and it is the lightest one [2]. Across 4,327 screened Colorado produced-gas analyses, ethane supplies 56.7% of the gallons [2]. Propane supplies a further 25.0% [2].
Every one of those analyses is a filed agency record, held against the well it came from in TetraSoft Atlas [2]. A subscriber can read the component vector behind any single well rather than a state average.
| Component | Share of the recoverable gallons |
|---|---|
| Ethane | 56.7% |
| Propane | 25.0% |
| Butanes | 12.7% |
| Pentanes | 4.4% |
| Hexanes-plus | 1.3% |
Median shares across the screened Colorado produced-gas analyses. [2]
What those gallons are worth is a separate question with a moving answer. The EIA publishes a monthly natural gas liquid composite price, derived from Mont Belvieu spot data and weighted by plant production [4]. It read 7.04 dollars per million Btu for June 2026 [4].
Multiplying a GPM figure by that month’s composite is the arithmetic. Quoting a price here would be out of date before the post was.
That concentration is why ethane recovery is the decision that moves a plant’s economics. A plant rejecting ethane leaves more than half its potential liquid volume in the residue gas. The heavier components are worth more per gallon but there is far less of them.
What each component fetches is harder to publish than it looks. EIA builds its composite from Mont Belvieu assessments it buys, and publishes the composite rather than the components [4]. Propane is the one component whose spot price EIA publishes directly, at 0.688 dollars per gallon for August 2026 [5].
| Component | Share of US plant production | Priced against |
|---|---|---|
| Ethane | 42.0% | Natural gas, because rejection is always the alternative |
| Propane | 30.1% | Heating and petrochemical demand; 0.688 dollars per gallon, August 2026 |
| Natural gasoline | 12.1% | Crude, as a gasoline blendstock and heavy-crude diluent |
| Normal butane | 9.6% | Gasoline blending and petrochemical feedstock |
| Isobutane | 6.1% | Alkylate for gasoline octane |
Shares are of the 7,885 thousand barrels per day of US plant production in June 2026. Only the propane price is published by EIA; the other components are assessed by subscription services. [6]
The ordering by weight is a guide rather than a rule. Ethane tracks natural gas rather than crude, because leaving it in the stream is always the alternative. Isobutane is lighter than normal butane and sells into alkylation for octane, which is a different market from fuel [3].
Condensate, NGLs and Residue Gas Are Not the Same Product
Three products leave a wellhead stream and the names are routinely swapped. The separation point rather than the chemistry decides which name a barrel carries.
| Where it leaves the stream | Sold as | Still in the gas at the plant inlet | |
|---|---|---|---|
| Condensate | Wellsite separator, at lease conditions | Liquid barrels at the lease | No |
| NGLs | Gas processing plant, by fractionation | Ethane, propane, butanes, pentanes | Yes |
| Residue gas | Leaves the plant as the remaining vapour | Pipeline gas on heat content | Yes, and it is what remains |
The same compound can be sold under two names depending on where it condensed.
At the lease means at the wellsite itself, where the separator runs at whatever temperature and pressure the site holds, and the liquid it drops out is metered and sold there before the remaining gas travels anywhere.
Liquefied natural gas belongs to none of those rows. Liquefied natural gas is the methane itself, chilled until it becomes liquid for transport. That is what leaves the US Gulf Coast for Europe, which took a record 10.3 billion cubic feet a day in 2025 [7]. Europe is the largest destination region for US LNG, at 68% of export volumes that year [7].
How Much NGL Wellhead Gas Carries, Measured as GPM
GPM converts a mole percentage into the liquid volume a plant could recover. A thousand cubic feet of gas at 60 degrees Fahrenheit and 14.696 psia holds 2.635 pound-moles. Multiplying that by each component’s molecular weight and dividing by its liquid density at 60 degrees gives gallons per mole percent.
| Component | Gallons per Mcf per mole % |
|---|---|
| Ethane | 0.267 |
| Propane | 0.275 |
| Isobutane | 0.326 |
| Normal butane | 0.315 |
| Isopentane | 0.365 |
| Normal pentane | 0.361 |
| Hexanes-plus | 0.410 |
Derived from component molecular weights and 60 degree Fahrenheit saturated liquid densities.
Colorado operators file gas chromatography analyses that make this calculable per well [2]. The counts and medians below were computed on 4 September 2026 and grow as agencies publish new analyses.
Across 4,327 screened produced-gas analyses from 2,929 Colorado wells, the median stream is 73.5% methane [2]. Ethane adds 12.46% and propane 5.34% [2]. Running every analysis through the factors above and taking the middle value gives 5.92 gallons per Mcf. [2]
A million cubic feet of that gas therefore carries about 141 barrels of recoverable liquid.
The mole basis is worth checking rather than assuming. Treating the filed percentages as mole fractions reproduces each record’s own filed heating value across 15,466 Colorado analyses [2]. Reconstructing each record’s filed specific gravity the same way agrees to 0.10%, against 14.2% on a mass basis [2].
Specific gravity is the cleaner test of the two, because it is a molar-mass ratio with no heating-value convention in it. The median error is 0.37% [2]. Treating them as mass fractions misses by 9.55% [2].
Richness shows up in the heat content as well as the barrel count. The median Colorado produced-gas analysis reads 1,234 Btu per dry cubic foot [2].
That is the same C2-plus fraction the GPM calculation counts, read as energy rather than as liquid. Natural Gas BTU: What Wellhead Gas Actually Measures carries the same eight states as a heating-value distribution [8]. It reports 31,823 analyses with state medians from 1,033 to 1,206 Btu per standard cubic foot, each with its own fifth-to-ninety-fifth percentile band [8].
Why a State Average Cannot Stand In for a Well
The variation inside a state is larger than the variation between states [2]. Across 8,882 screened USGS analyses from 7,853 wells in eight states, the state medians span 1.13 to 3.02 gallons per Mcf. [2] Those counts and medians were computed on 4 September 2026. The fifth to ninety-fifth percentile range within one state runs from four times wide in Ohio to thirty-nine times wide in Wyoming [2].
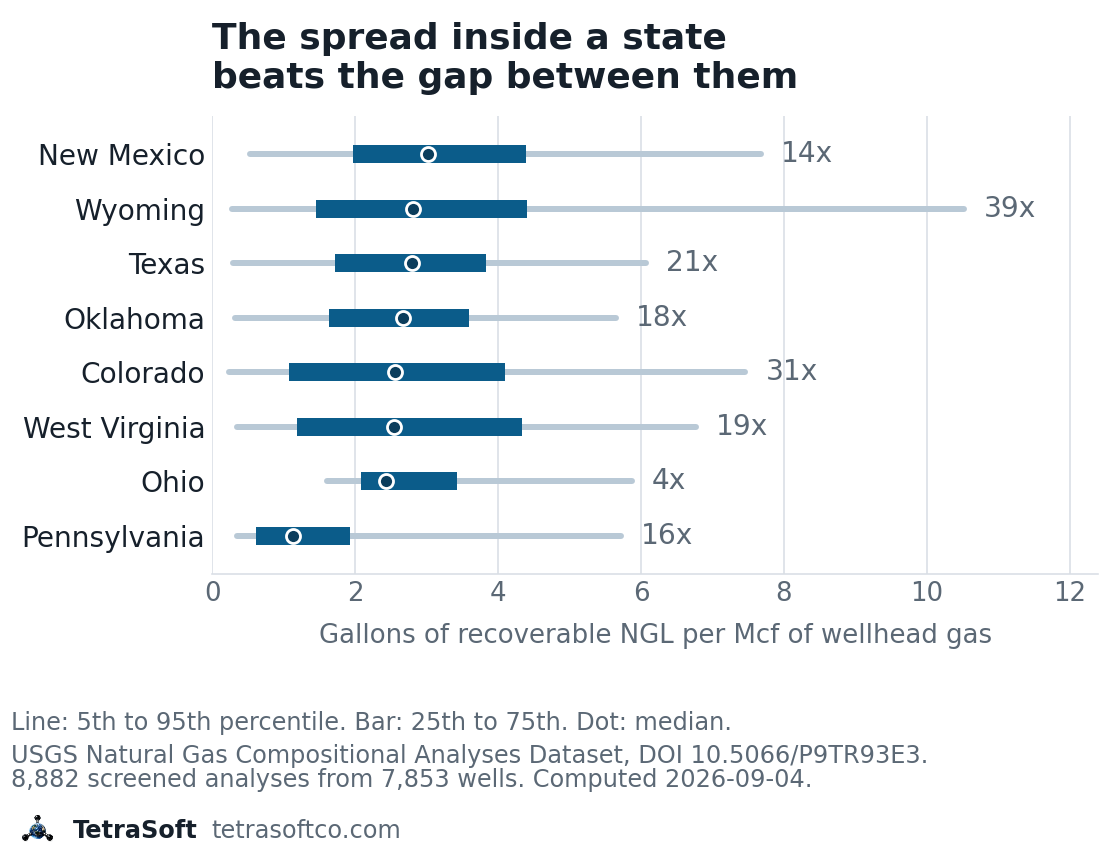
All eight percentile bands share a common span from 1.61 to 5.65 gallons per Mcf.
Published basin ranges show the same width. The Congressional Research Service puts the Barnett at 2.5 to 3.5 gallons per Mcf. [9] The same report puts the Utica at 4 to 9 and the Bakken at 6 to 12 [9]. A single formation spanning 6 to 12 is a wider band than the gap between most state medians.
Two Colorado datasets make the point sharply. The historical USGS samples put Colorado’s median at 2.56 gallons per Mcf, while the modern operator filings put it at 5.92 [2]. The gap is a sampling difference rather than a measurement dispute, since the two sets cover different eras and different well populations. A number that moves by that much between two honest samples of one state is not a number to assume.
Richer Gas Is Hotter Gas
Liquid content and heat content move together, because the same components drive both. Sorting the Colorado produced-gas analyses by GPM shows the relationship directly [2].
| GPM band | Analyses | Median GPM | Median Btu per dry cubic foot | Median methane |
|---|---|---|---|---|
| Under 3 | 162 | 1.22 | 588 | 39.0% |
| 3 to 5 | 837 | 4.44 | 1,123 | 77.3% |
| 5 to 7 | 2,516 | 5.99 | 1,231 | 74.3% |
| 7 and over | 812 | 7.66 | 1,330 | 68.9% |
Every step up in liquid content is a step up in heating value and a step down in methane fraction. [2]
The richest band sits three hundred Btu above the pipeline assumption, and the leanest sits far below it. That leanest band is not lean gas so much as diluted gas, at a median of 39.0% methane [2].
Where Per-Well NGL Composition Is Actually Recorded
Three tiers of NGL data exist, and they answer different questions. EIA publishes national plant liquids production monthly, by component, which describes plant output [6]. The state series exists but stops at 2021 and carries no Pennsylvania column [10]. Those series tell an analyst what was recovered, not what a particular stream contained.
State agencies hold the per-well layer [2]. Colorado operators file analyses through ECMC, and Ohio, Pennsylvania, West Virginia and Wyoming publish their own records [2]. The Colorado filings sit alongside the rest of that agency’s records in COGCC (Now ECMC) Oil & Gas Data, Cross-Linked and Faster Than the State Portal. The USGS compositional analyses dataset adds a national historical layer with its own component fields and its own units [1].
The obstacle is not availability. Each agency publishes a different schema, component list and well identifier [2]. A stream’s composition and the well it came from therefore sit in separate systems. Reconciling those records onto one well is the work, and it is the work TetraSoft Atlas does.
Atlas will not price a barrel of propane or tell an operator what a processor will pay. MAES, the mechanistic emissions model TetraSoft uses through a CSU partnership, takes a gas analysis as an input. The model does not tell an operator what the NGL content is either.
What Atlas does is put the filed analysis next to the well on the map. The composition behind a GPM number becomes a record rather than an assumption.
Colorado’s own two datasets disagree by a factor of two [2]. Starting from the filed analysis for a specific well is the cheaper error to make.
What Each Source Actually Publishes
The three tiers publish different fields, which is what makes them hard to combine. EIA reports plant output as barrels, by component nationally each month [6]. Its state breakdown is annual and ends in 2021 [10]. State filings and the USGS records report component fractions per sample [2].
| Source | Unit of record | What it gives | What it does not |
|---|---|---|---|
| EIA plant liquids series | National monthly, state annual to 2021 | Barrels recovered, by component nationally | Any per-well detail, or state data after 2021 |
| State agency filings | One filed analysis | Components, heating value, sample date | A common schema across states |
| USGS compositional dataset | One historical sample | Components and location | Recent samples at producing wells |
Only the middle and bottom rows carry composition, and neither carries it in the same shape.
Per-state medians differ enough to matter and not enough to substitute for a well [1].
| State | Ethane | Propane | Butanes | Pentanes | C6+ | Median GPM |
|---|---|---|---|---|---|---|
| New Mexico | 6.20 | 2.51 | 1.10 | 0.40 | 0.20 | 3.02 |
| Wyoming | 6.00 | 2.20 | 0.90 | 0.35 | 0.18 | 2.81 |
| Texas | 5.50 | 2.60 | 1.10 | 0.40 | 0.20 | 2.80 |
| Oklahoma | 5.20 | 2.40 | 1.09 | 0.40 | 0.20 | 2.67 |
| Colorado | 5.00 | 1.89 | 0.99 | 0.40 | 0.20 | 2.56 |
| West Virginia | 6.20 | 1.80 | 0.80 | 0.30 | 0.10 | 2.55 |
| Ohio | 5.60 | 1.80 | 0.81 | 0.30 | 0.20 | 2.43 |
| Pennsylvania | 3.06 | 0.50 | 0.20 | 0.10 | 0.10 | 1.13 |
Median mole % by component, USGS analyses. [1]
How to Read a Gas Analysis
A gas analysis is a component vector plus a few derived numbers. The three things worth checking first are the basis, the tail and the total.
The basis is mole % or mass %, and the two are not interchangeable. Treating one as the other misstates GPM by roughly a tenth [2]. The check is arithmetic: recompute the sheet’s own heating value from its components and see which basis reproduces it.
The tail is the hexanes-plus bucket, which groups everything heavier than pentane into one number [2]. That bucket is the smallest share of the gallons and the densest per mole % [2]. A large hexanes-plus fraction is the signature of a rich stream.
The total is the sum of the reported components, which should land near 100. Analyses that miss that by more than a few per cent are the ones to set aside.
Frequently Asked Questions
What is the difference between NGLs and LNG?
NGLs are separate compounds recovered as liquids at ordinary temperatures under modest pressure. LNG is methane itself, cooled to roughly minus 162 degrees Celsius so that it becomes liquid. NGLs are a group of products; LNG is a physical state of the main product.
Can NGLs be recovered at the wellsite instead of a plant?
Only the heavy end, which is what a separator already does. Recovering ethane and propane needs the low temperatures a processing plant provides. Wellsite equipment therefore shifts the split between condensate and NGLs rather than replacing the plant.
What GPM counts as rich gas?
Around three gallons per Mcf and above is commonly called rich, and under one gallon per Mcf lean. The terms are trade usage rather than definitions, so they should not be treated as thresholds. Across 4,327 screened Colorado produced-gas analyses, 96.3% sit at or above three gallons per Mcf. [2]
Why would a plant leave ethane in the gas?
Because recovering ethane only pays when the liquid is worth more than the heating value it removes from the residue gas. Plants move between recovery and rejection as that spread changes. The ethane appears in the analysis either way, which is why composition and recovered volume are different numbers.
Where does TetraSoft Atlas get its gas composition records?
From state agency filings and the USGS Natural Gas Compositional Analyses Dataset, joined to the well each sample came from [2]. Colorado analyses arrive through ECMC filings, and Ohio, Pennsylvania, West Virginia and Wyoming publish their own [2]. The records keep the components and units each agency reports rather than being forced into one template.
Why would a plant reject ethane when it is most of the barrel?
Because volume and value are different questions. Ethane supplies 56.7% of the recoverable gallons in the screened Colorado analyses [2]. Left in the residue gas it is sold on heat content instead, and when that is worth more the plant rejects it.
Does a richer stream always mean more revenue?
Not automatically, because recovery costs money and the residue gas loses heat content. A richer stream raises both the potential liquid volume and the processing required to get it. GPM sets the size of the opportunity rather than the size of the margin.
How often does a well’s gas composition change?
Enough that the sample date belongs on any number taken from it. A filed analysis describes the stream on the day it was taken [2]. Older analyses are dated observations rather than stale ones, provided the date travels with the number.
A GPM number carries every downstream calculation that depends on what the gas contains. Atlas puts the filed analyses across eight states next to the wells they came from [2]. Start your free 7-day trial.
References
- USGS Natural Gas Compositional Analyses Dataset, DOI 10.5066/P9TR93E3. U.S. Geological Survey, Natural Gas Compositional Analyses Database. https://doi.org/10.5066/P9TR93E3
- TetraSoft Atlas, multi-state wellhead gas composition dataset. Gas chromatography analyses across eight states, sourced from state agency filings and the USGS Natural Gas Compositional Analyses Dataset, verified 2026-09-04. https://www.tetrasoftco.com/atlas-landing.html
- U.S. Energy Information Administration. Uses of hydrocarbon gas liquids. https://www.eia.gov/energyexplained/hydrocarbon-gas-liquids/uses-of-hydrocarbon-gas-liquids.php. Accessed 10 September 2026.
- U.S. Energy Information Administration. U.S. Natural Gas Liquid Composite Price (Dollars per Million Btu). https://www.eia.gov/dnav/ng/hist/ngm_epg0_plc_nus_dmmbtum.htm. June 2026 data, released 31 August 2026.
- U.S. Energy Information Administration. Mont Belvieu, TX Propane Spot Price FOB. https://www.eia.gov/dnav/pet/hist/eer_epllpa_pf4_y44mb_dpgD.htm. August 2026 monthly average.
- U.S. Energy Information Administration. U.S. Natural Gas Plant Field Production. https://www.eia.gov/dnav/pet/pet_pnp_gp_dc_nus_mbblpd_m.htm. June 2026 data, released 31 August 2026.
- U.S. Energy Information Administration. U.S. natural gas exports to grow nearly 30% by 2027 as LNG facilities ramp up, 16 April 2026. https://www.eia.gov/todayinenergy/detail.php?id=67484
- TetraSoft Atlas, multi-state wellhead heating value dataset. Filed heating values across eight states, verified 2026-09-04. https://www.tetrasoftco.com/atlas-landing.html
- Congressional Research Service. Natural Gas Liquids: The Unknown Hydrocarbons, R45398, October 2018. https://www.everycrsreport.com/reports/R45398.html
- U.S. Energy Information Administration. Natural Gas Plant Liquids Production by state. https://www.eia.gov/dnav/ng/ng_prod_ngpl_s1_a.htm. Annual series ending 2021.
This post is for informational purposes only and does not constitute legal or compliance advice. Consult qualified legal counsel or a compliance professional for guidance specific to your operations and jurisdiction.
Interactive tool
NGL content calculator
Enter a gas analysis and this returns its GPM, the gallons of recoverable liquid carried in one Mcf. Prefilled with the median Colorado produced-gas composition.
Compositionmole per cent, not mass
Methane, carbon dioxide and nitrogen are not entered: they carry no recoverable liquid.
Recoverable liquid
5.87 gallons per Mcf
Rich
- Per MMcf
- 139.7 bbl
- C2 through C6+
- 21.03%
Where the gallons come from
| Component | Mole % | Factor | Gal/Mcf |
|---|---|---|---|
| Ethane | 12.46 | 0.2668 | 3.324 |
| Propane | 5.34 | 0.2749 | 1.468 |
| Isobutane | 0.74 | 0.3264 | 0.242 |
| Normal butane | 1.60 | 0.3146 | 0.503 |
| Isopentane | 0.36 | 0.3650 | 0.131 |
| Normal pentane | 0.35 | 0.3613 | 0.126 |
| Hexanes-plus | 0.18 | 0.4103 | 0.074 |
Each factor is one Mcf of gas at 379.49 cubic feet per pound-mole, times the component's molecular weight, divided by its liquid density at 60F.
Against the eight state medians
Rich is trade usage for roughly 3 gallons per Mcf and above, lean for under 1. No standards body defines either boundary. State medians from the USGS Natural Gas Compositional Analyses Dataset (DOI 10.5066/P9TR93E3), 8,882 screened analyses; the Colorado default from 4,712 screened ONGAEIR produced-gas analyses, both computed 2026-09-04. Nothing leaves your browser.
Comments
0Share your thoughts. All comments are moderated before appearing.
No comments yet. Be the first to share your thoughts!