Siting a pad, clearing the legal distance from a home, confirming which lease a lateral crosses: each is a map question. A geographic information system, or GIS, is the software that answers them by stacking well, lease, pipeline, production and emissions layers on one map. The catch is that the eight state agencies in this post publish their well data in six different coordinate systems [1].
A layer loaded in the wrong system can sit 10 to 200 meters from where it belongs. That is enough to move a well across a setback, the legal minimum distance between a well and a home or water well. This post covers US onshore well data: each state’s system, the three traps that move a well, and the conversion that fixes each.
Quick Answer: Oil and gas GIS maps wells, laterals, leases, pipelines, production and emissions so land, engineering and compliance teams can answer location questions. The eight state agencies here publish their well layers free, as shapefiles or ArcGIS map services, and the table below links each [1]. Those layers use six coordinate systems, so convert them to one datum before measuring anything. TetraSoft Atlas, our subscription platform for multi-state well records, has already put all eight states on one map.
TetraSoft Atlas draws all eight states together on one map, with their well, production and emissions records. We are expanding Atlas to every US state [2].
Oil and Gas GIS Layers, and the Coordinate System Each State Uses
An oil and gas GIS map is built from two kinds of layer: geometry you can draw and attributes you can only join. The geometry layers are well points, laterals, lease and unit polygons, field outlines, pipelines and facility points. A lateral is the horizontal section of a well that actually produces, and a unit is acreage pooled from several leases and drilled as one. The RRC GIS Viewer: The Texas Railroad Commission Public Map post walks through one agency’s layers one by one.
Two supporting layers sit under the wells: the land survey grid and pipelines. Each agency in the table below publishes its wells, and Texas is the example here because its regulator publishes all three layers together. Its well, survey and pipeline layers come by county as shapefiles, updated twice a week [3].
Survey layers are the land grid that legal descriptions cite: the Public Land Survey System in most western states, and Texas’s own survey system. Setback screens add buildings and water wells, which come from county and water agencies rather than the oil and gas regulator.
Every layer carries a datum and, often, a projection. A datum is the model of the Earth’s shape that fixes where a latitude and longitude fall. NAD27 and NAD83 are the North American Datums of 1927 and 1983.
WGS 84, the World Geodetic System of 1984, is the datum GPS receivers and web maps use. A projection flattens the Earth onto a grid measured in meters or feet, such as Universal Transverse Mercator (UTM) zones or a state plane system.
The table shows the system each agency uses for its well locations [1]. Each carries an EPSG code, the registry number GIS software uses to name a coordinate system [1].
| State | Agency and source | Coordinate system | EPSG code |
|---|---|---|---|
| Texas | Railroad Commission of Texas GIS data | NAD27, latitude and longitude | 4267 |
| Colorado | ECMC downloadable data | NAD83, UTM zone 13N | 26913 |
| New Mexico | OCD public wells service | NAD83, latitude and longitude | 4269 |
| Oklahoma | OCC wells service | WGS 84, latitude and longitude | 4326 |
| Ohio | ODNR wells service | NAD83, Ohio State Plane South, US feet | 3735 |
| Pennsylvania | DEP oil and gas map service | WGS 84, Web Mercator | 3857 |
| West Virginia | WVDEP oil and gas map service | WGS 84, Web Mercator | 3857 |
| Wyoming | WOGCC active wells service | WGS 84, Web Mercator | 3857 |
Coordinate systems as published in each agency’s metadata or map-service description, read September 22 and 23, 2026. Web Mercator is the display projection most web maps use, on the WGS 84 datum. [1]
The Colorado Oil & Gas Map: Emissions and Enforcement Data post shows what one state’s layers hold once they share a system.
Production Joins on a Key; Emissions Arrive as Points
Production has no coordinates, so it reaches the map through an identifier. For most wells that identifier is the API number, the 10- to 14-digit code a state assigns to each well. The API Well Number Lookup: What It Is and How to Read One post decodes it digit by digit.
Texas is the exception. Its regulator states that “In Texas, production is reported by each oil and gas lease rather than individual well.” [4] Texas production therefore joins on the lease number, and a per-well Texas figure is a share of its lease.
Emissions arrive the other way: as facility points that carry their own latitude and longitude. Subpart W of 40 CFR Part 98 is EPA’s greenhouse gas reporting rule for oil and gas systems [5]. It has long counted all of an operator’s onshore wells in a basin as one facility [5]. One federal point can therefore stand for a whole basin.
Its May 2024 amendments added a record for each well pad [6]. That record includes “the location (i.e., representative latitude and longitude coordinates).” [6]
That reporting is due to start with reporting year 2025. Whether it happens is open.
EPA proposed on September 16, 2025 to suspend the remaining Subpart W reporting until reporting year 2034. That proposal had not been finalized as of September 2026. State emissions inventories continue regardless, as the What Is Subpart W Suspension? State Rules Still Apply post explains.
Colorado’s ONGAEIR Maps Emissions Facility by Facility
Colorado collects oil and gas emissions facility by facility, not by basin. Its Oil and Natural Gas Annual Emission Inventory Reporting program is known as ONGAEIR [7]. The program page states that “Oil and gas operators must submit annual emissions inventory reports” by June 30 each year [7]. Each facility report carries its own coordinates and the equipment on site.
For reporting year 2023, Atlas holds 16,123 Colorado ONGAEIR facility reports covering 113,355 equipment records [8]. The GHGRP lists 108 Colorado oil and gas facilities for the same year [8]. On a Colorado map, ONGAEIR is the most detailed emissions layer there is.
Three Coordinate Traps That Move a Well
Three traps account for most wells that land in the wrong place. The first is NAD27 latitude and longitude read as NAD83, and the second is projected coordinates read on the wrong datum. The third is a planned or calculated point read as a surveyed one. The figure below sets the first two against a real setback, while the gap between NAD83 and WGS 84 stays small enough to ignore [9].
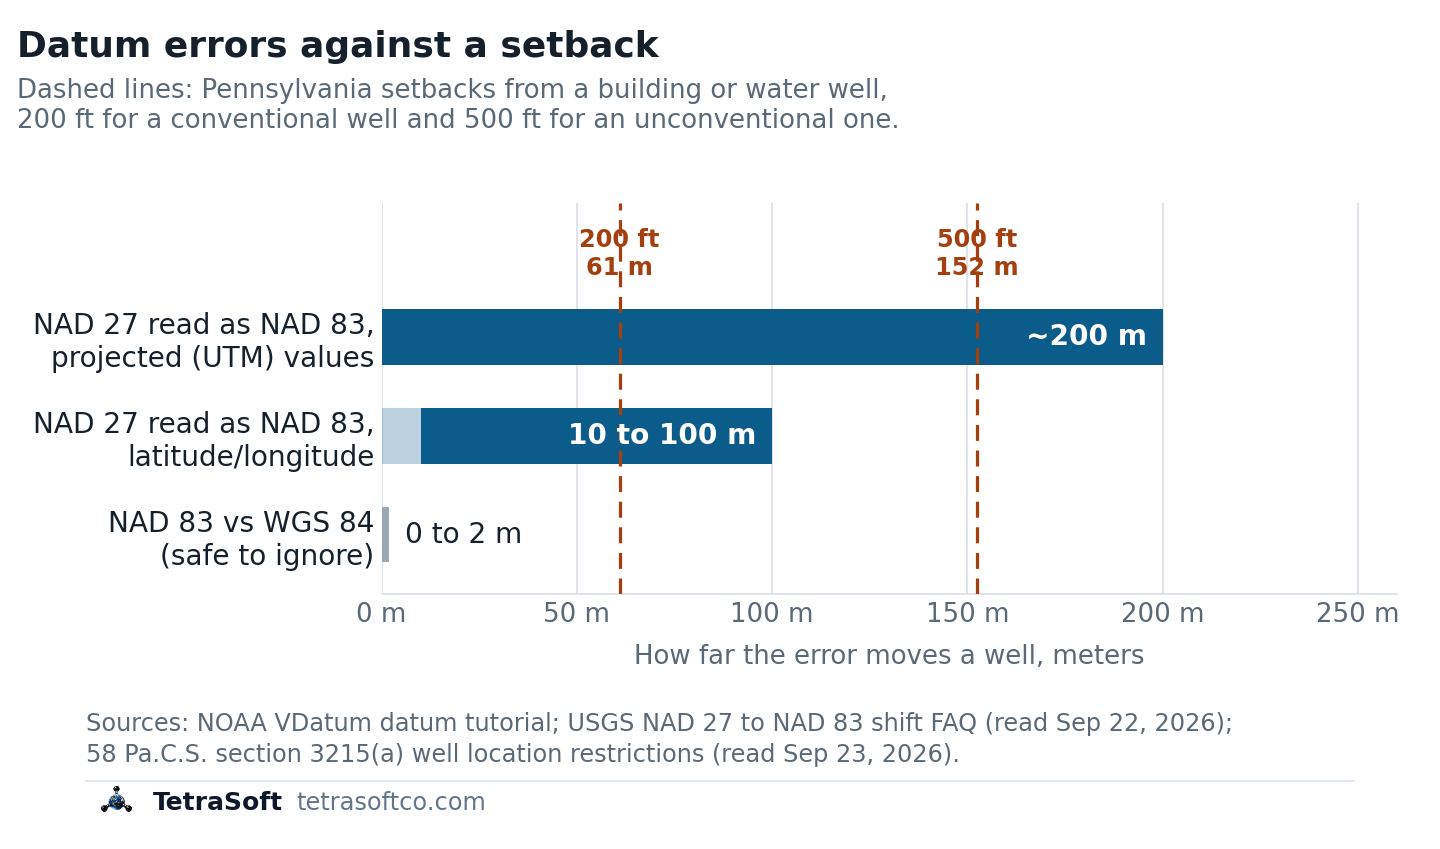
The latitude and longitude error can use up most of a 200-foot setback; the projected-value error clears both Pennsylvania setbacks on its own.
NAD27 on the Wrong Datum Moves a Well 10 to 200 Meters
Reading NAD27 latitude and longitude as NAD83 moves a well 10 to 100 meters [10]. The U.S. Geological Survey (USGS) puts the shift “in the range of 10-100 ground meters” across the lower 48 states, depending on location [10]. The same pair of numbers simply means a different point on the two datums.
Setbacks show why that matters. Pennsylvania bars a well within 200 feet, or 500 feet for an unconventional gas well, of a building or water well without the owner’s consent [9]. At the high end, a 100 meter error is more than one and a half times the 61 meter conventional setback.
Projected coordinates move further than latitude and longitude when the datum is wrong [10]. USGS states that “Changes to UTM values are generally larger, around 200 meters.” [10] The trap is a UTM file with no datum stated: NAD27 zone 13N (EPSG:26713) and Colorado’s NAD83 zone 13N (EPSG:26913) look identical as numbers.
About 200 meters clears both Pennsylvania setbacks, including the 152 meter one for unconventional wells. Nobody sees that error on the map, because a shifted point still looks plausible.
A Planned Location Is Not a Surveyed One
The gap between a planned location and a surveyed one has no fixed size. It is quieter. Colorado’s wells metadata qualifies each point as “Planned = Not Drilled; Actual = Drilled” [11]. New permits have carried GPS coordinates only since December 1, 2005 [11]. Older points were spotted from a land grid, so read the qualifier before trusting a point to the meter.
A lateral is a different matter: it is the well’s real extent, not an error. The average lateral of a new horizontal Permian well reached 10,867 feet, about 3.3 kilometers, in 2025 [12]. For a lease or subsurface question, draw the lateral, not the surface point; the Southern Permian Oil Jumped 14% in 2024: Emissions Impact post covers the basin behind that number.
Eight states, six coordinate systems, one map. See all eight already converted in TetraSoft Atlas during a seven-day trial.
How to Fix a Datum Mismatch Before It Reaches a Decision
Fixing a mismatch takes five steps, and all of them happen before any distance is measured.
- Find the datum. Open the.prj file that ships with each shapefile, the most common GIS file format; it stores the layer’s coordinate system. Without one, use the agency metadata in the table above.
- Set the project coordinate system first, for example NAD83 (EPSG:4269), or NAD83 UTM zone 13N (EPSG:26913) for distance work in Colorado.
- Convert NAD27 with EPSG:1241. The EPSG registry lists it as “NAD27 to NAD83 (1)”, a NADCON grid method for the United States at “0.2m level of accuracy.” [13] NADCON is the North American Datum Conversion utility from NOAA’s National Geodetic Survey [14]. In QGIS or ArcGIS Pro, the two desktop GIS packages most analysts use, pick it when the software asks how to convert.
- Treat NAD83 and WGS 84 as equivalent at well scale. EPSG:1188, their standard transformation, is rated “Accuracy 2m in each axis.” [13]
- Check one known well. Plot a well you have surveyed and confirm it lands on its pad in satellite imagery.
The checker below takes your two layers’ datums and your decision’s margin, then names the conversion to apply. It starts at 200 feet, the Pennsylvania conventional setback [9].
TetraSoft Atlas Puts the Eight States on One Map
TetraSoft Atlas has already drawn the eight states’ well layers on one web map, so the conversions above are done before you start. Those eight states produced 68 percent of US crude oil and 83 percent of US marketed gas in 2025 [15]. They include Texas and New Mexico, the two largest oil producers, and Pennsylvania, the second-largest gas producer [15].
Atlas holds about 2.7 million well records across Colorado, New Mexico, Ohio, Oklahoma, Pennsylvania, Texas, West Virginia and Wyoming [16]. Texas laterals and pipelines arrive converted from NAD27 to WGS 84, and Texas production is allocated from each lease to its wells.
Atlas is self-serve, with no sales call: you sign up and start a 7-day trial with no credit card [2].
Well points and production cover all eight states [17]. Atlas holds lateral records for Colorado, Ohio, Texas and West Virginia, and draws the Texas laterals as lines on the map [17]. Emissions facility layers cover Colorado, Ohio, Pennsylvania, Texas, West Virginia and Wyoming [17]. The Oil and Gas Well Map: 2.7M Wells Across Eight States post shows the map itself, and the Oil and Gas Data Analytics Platforms: How to Choose One guide sets out six tests for any platform’s joins.
Check your own wells against the table above before any setback screen.
Frequently Asked Questions
How is GIS used in the oil and gas industry?
GIS supports a well’s whole life, not only its location. Geologists map formations and prospects. Land teams work with leases and units, while engineers plan pads, pipelines and road access. Compliance teams screen setbacks and map inspections and spills. Emissions teams increasingly map facilities and satellite detections against wells.
What is a shapefile?
A shapefile is a common GIS format that stores map features in files sharing one name. The.shp file holds the geometry, the.dbf holds the attributes, the.shx indexes them, and the.prj records the coordinate system. A shapefile missing its.prj is the usual source of a datum guess. Texas publishes its map layers as shapefiles [18].
Where can I download oil and gas GIS data for free?
The state regulators publish their well layers at no charge [3]. Texas lists well layers by county as shapefiles on its data sets download page, updated twice a week [3]. Colorado posts well surface locations as shapefiles, updated daily, on its downloadable data page [19]. New Mexico, Oklahoma, Ohio, Pennsylvania, West Virginia and Wyoming serve theirs as public ArcGIS map services [1].
Is WGS84 the same as NAD83?
For mapping wells, you can treat them as the same. NOAA, the National Oceanic and Atmospheric Administration, says “the horizontal components of WGS 84 and NAD 83 may be considered equivalent” at most map scales [20]. The tutorial puts the two datums’ reference origins about 2 meters apart [20]. NAD27 is the one that needs a real conversion.
This post is for informational purposes only and does not constitute legal or compliance advice. Consult qualified legal counsel or a compliance professional for guidance specific to your operations and jurisdiction.
References
- State agency map-service metadata for New Mexico, Oklahoma, Ohio, Pennsylvania, West Virginia and Wyoming, accessed September 23, 2026
- TetraSoft Atlas landing page, tetrasoftco.com/atlas-landing.html, accessed September 23, 2026
- Railroad Commission of Texas, Data Sets Available for Download, accessed September 23, 2026
- Railroad Commission of Texas, Production Data Query System (PDQ) FAQs, accessed September 23, 2026
- 40 CFR 98.238, Definitions, Subpart W (Petroleum and Natural Gas Systems)
- 89 FR 42062, Greenhouse Gas Reporting Rule: Revisions and Confidentiality Determinations for Petroleum and Natural Gas Systems, May 14, 2024
- Colorado Department of Public Health and Environment, ONGAEIR program page, accessed September 23, 2026
- TetraSoft Atlas, Colorado ONGAEIR and GHGRP records read September 23, 2026
- 58 Pa.C.S. § 3215, Well location restrictions, accessed September 23, 2026
- U.S. Geological Survey, How large is the North American Datum of 1927 (NAD 27) to NAD 83 shift?, accessed September 22, 2026
- Colorado Energy and Carbon Management Commission, Wells shapefile metadata, accessed September 22, 2026
- U.S. Energy Information Administration, Longer wells boost Permian crude oil and natural gas production, Today in Energy, August 19, 2026. https://www.eia.gov/todayinenergy/detail.php?id=67984
- EPSG Geodetic Parameter Dataset, EPSG:1241 and EPSG:1188 transformation records, accessed September 23, 2026
- U.S. National Geodetic Survey, NADCON: North American Datum Conversion Utility, accessed September 23, 2026
- U.S. Energy Information Administration, crude oil and natural gas marketed production by state, annual 2025, accessed September 23, 2026
- TetraSoft Atlas, per-state well counts read September 2026
- TetraSoft Atlas, state registry of map layers, read September 23, 2026
- Railroad Commission of Texas, Digital Map Information GIS Data FAQ, accessed September 22, 2026
- Colorado Energy and Carbon Management Commission, Downloadable Data and Documents, accessed September 23, 2026
- NOAA VDatum, A tutorial on datums, accessed September 22, 2026
Interactive tool
Datum mismatch checker
Pick the datum of your well layer and the layer you are overlaying, then enter the margin your decision has, such as how far a well clears a setback. It tells you whether an unconverted datum could erase that margin.
Verdict
Could exceed your margin
Documented shift 10 to 100 m against a 61.0 m margin
- A 10 to 100 meter shift applies (USGS, NAD 27 to NAD 83 shift FAQ).
- Documented shift
- 10 to 100 m
- Your margin
- 61.0 m
How to fix it
Convert the NAD27 layer with EPSG:1241 (NAD27 to NAD83), the NADCON grid, accurate to about 0.2 m.
USGS NAD 27 to NAD 83 shift FAQ; NOAA VDatum datum tutorial; EPSG registry; read September 2026. Bounds a horizontal datum mismatch in the lower 48 states. It does not model a surface point used for a bottomhole, which can be kilometers away.
Comments
0Share your thoughts. All comments are moderated before appearing.
No comments yet. Be the first to share your thoughts!