There is no official national map of US oil and gas wells, because onshore drilling is permitted and recorded state by state. The eight states covered here include the two largest oil producers, Texas and New Mexico, which together pump more than half of US crude [1]. They also include the two largest gas producers, Texas and Pennsylvania, which deliver nearly half of US natural gas [1]. Their regulators’ registers hold about 2.7 million wells between them, each behind its own portal, its own status vocabulary and its own export format [2]. Getting them onto one map means pulling all eight agency files and joining them on a shared identifier, the job this post walks through. All 2.7 million already sit on one screen in TetraSoft Atlas, our multi-state well data platform that joins well, production, emissions and enforcement records [3].
Quick Answer: US onshore well records are filed with individual state agencies, not a federal one, so there is no official national well map. The eight states covered here include the top two oil states and the top two gas states [1]. Together their registers hold about 2.7 million wells, 1.2 million of them in Texas [2]. The TetraSoft Atlas Platform maps all eight on one screen, refreshed monthly from the agency files [3]. Each well opens with its production, gas composition, emissions and enforcement history in one panel [3].
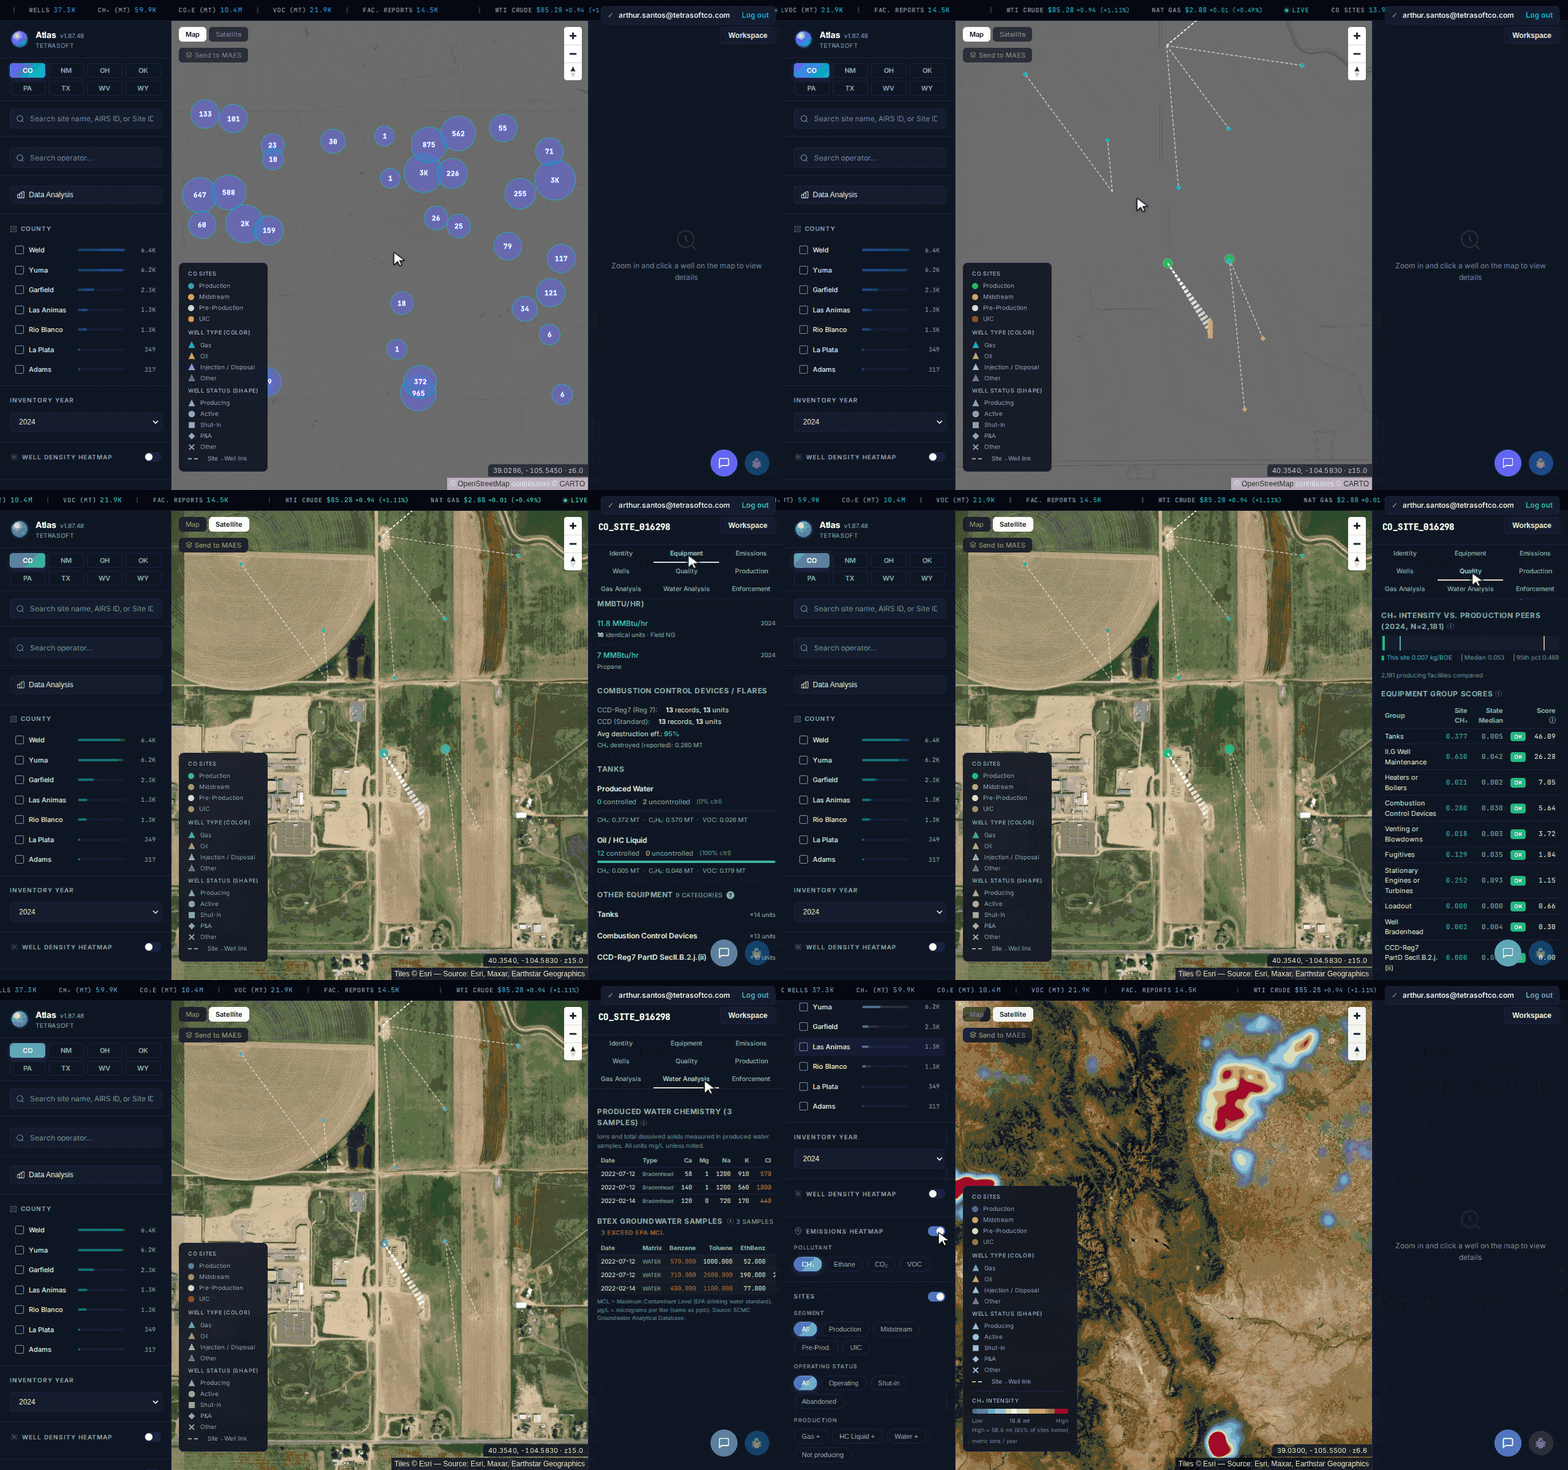
Colorado, from statewide clusters to one well’s full record: the production, gas composition and emissions tabs open without leaving the map [3].
Well Records Are Filed With Eight Separate State Agencies
Each producing state runs its own oil and gas regulator, and that regulator is the system of record for wells inside its borders [2]. The agency names, and the well counts they publish, differ widely [2].
| State | Agency of record | Wells on record | Share |
|---|---|---|---|
| Texas | Texas Railroad Commission (RRC) | 1,210,912 | 45.0% |
| Oklahoma | Oklahoma Corporation Commission (OCC) | 455,962 | 16.9% |
| Pennsylvania | Pennsylvania Department of Environmental Protection (DEP) | 279,274 | 10.4% |
| Ohio | Ohio Department of Natural Resources (ODNR) | 242,180 | 9.0% |
| West Virginia | West Virginia Department of Environmental Protection (WVDEP) | 167,332 | 6.2% |
| New Mexico | New Mexico Oil Conservation Division (OCD) | 141,461 | 5.3% |
| Colorado | Colorado Energy and Carbon Management Commission (ECMC) | 124,480 | 4.6% |
| Wyoming | Wyoming Oil and Gas Conservation Commission (WOGCC) | 68,746 | 2.6% |
| All eight | 2,690,347 | 100% |
*Each figure is that agency’s own register, from snapshots taken between 4 and 23 July 2026 and refreshed monthly; each agency name links to its portal. *
Texas holds 45 per cent of the eight-state total, more than the next four states combined [2]. Every row counts the same thing: wells on that regulator’s register, with no filter for age, status or whether the well was ever drilled [2]. That consistency is what makes the column addable at all.
The API Number Is the Only Field That Travels
Every agency issues well identifiers from the same national scheme, and that shared scheme is what makes a cross-state join possible at all. An API well number is 10 to 14 digits, with the first two encoding the state and the next three the county [4]. Texas is 42, Colorado is 05, and West Virginia is 47 [4].
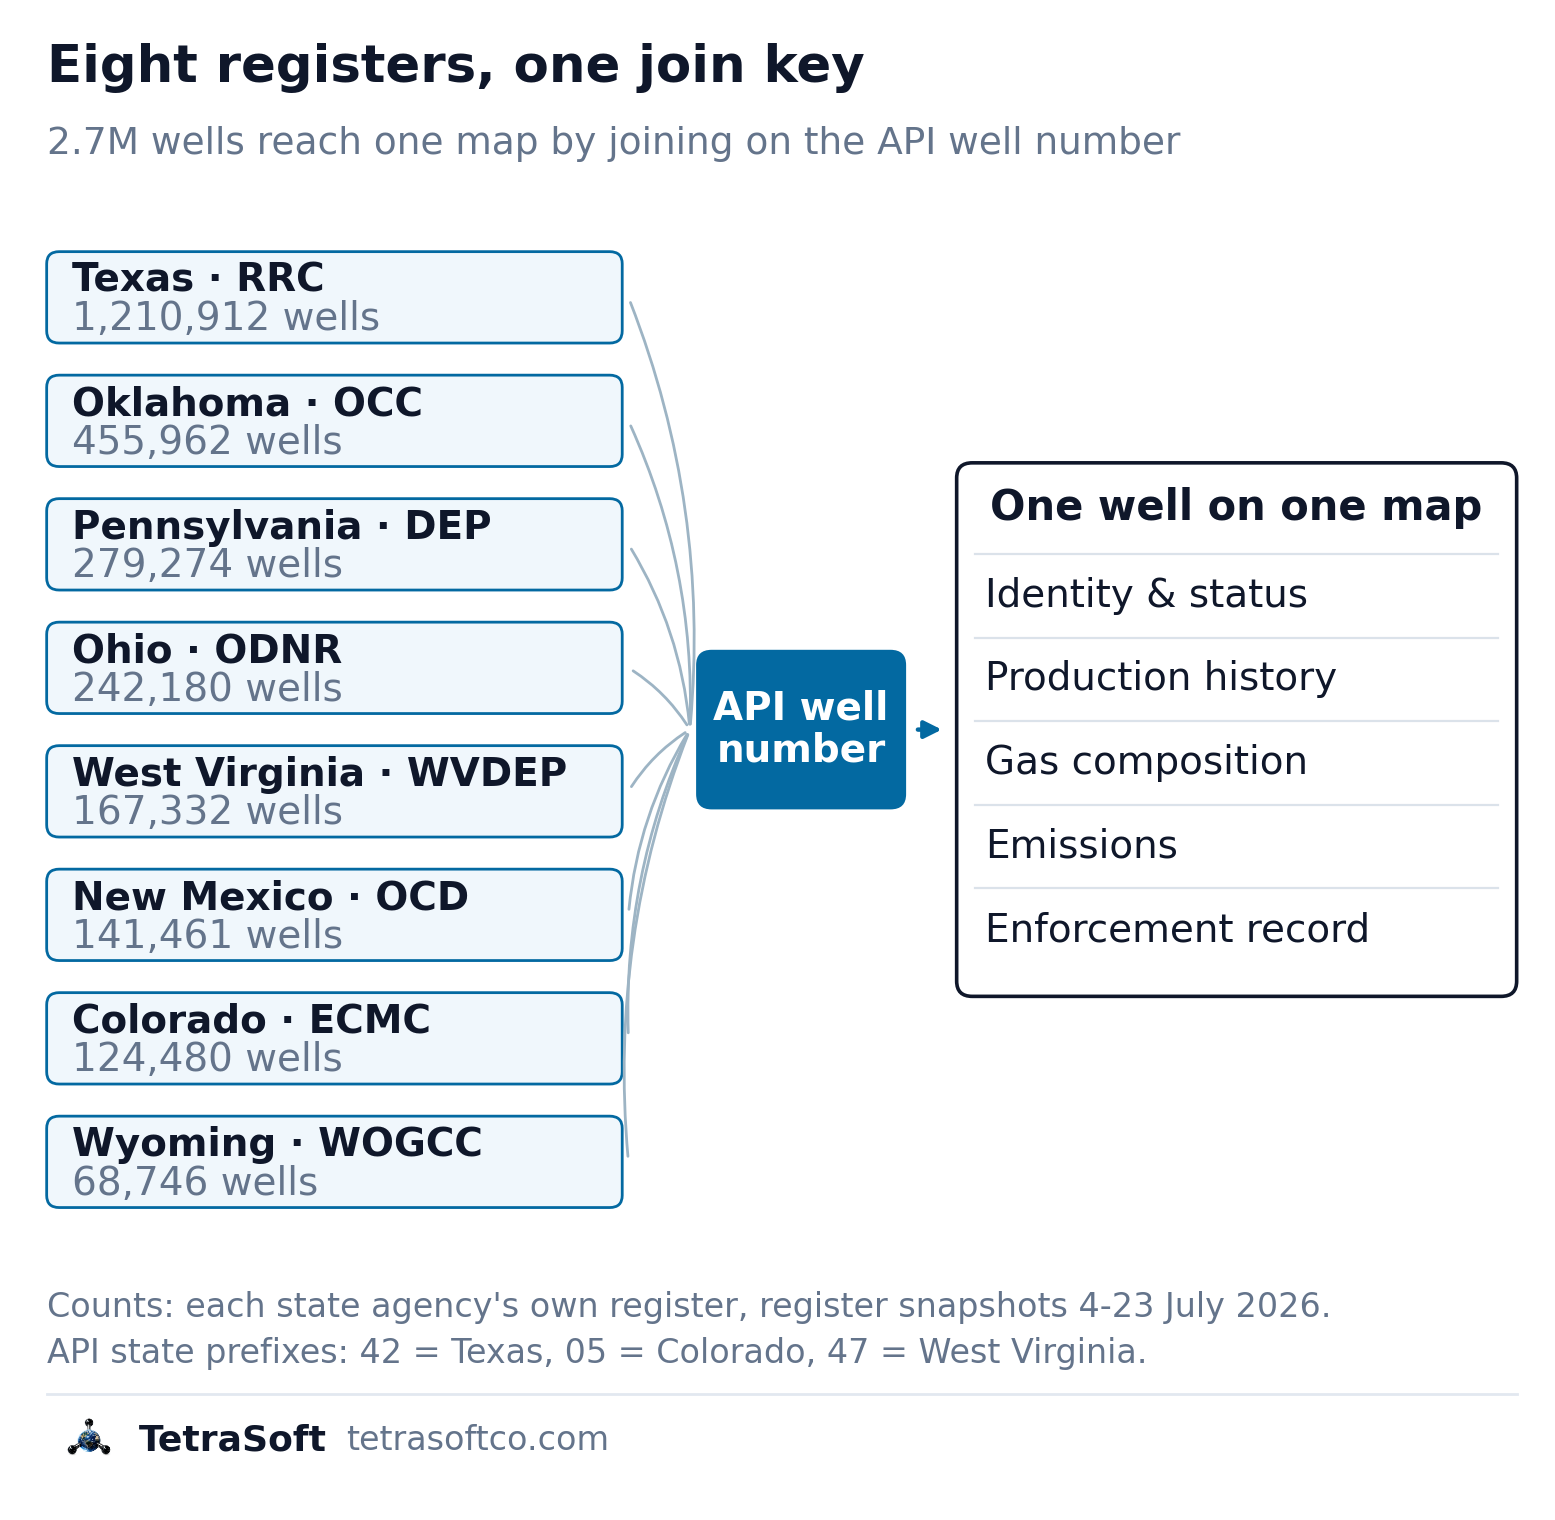
Eight agency registers converge on one identifier: the API well number is what lets 2.7 million wells land on one map with their records attached [2].
Name-matching fails at this job. Reading the identifier is covered in API Well Number Lookup: What It Is and How to Read One.
Status Vocabularies Do Not Match Across States
A well’s status means whatever its own agency means by it, and the categories do not line up. Four registers, four vocabularies [2].
| State | Largest status category | Second | Third |
|---|---|---|---|
| Texas | not stated (783,254) | producing (272,055) | shut in (75,591) |
| Oklahoma | plugged (252,387) | active (131,390) | unknown (44,291) |
| Ohio | plugged and abandoned (67,968) | producing (60,955) | final restoration (39,275) |
| Pennsylvania | active (111,669) | plugged OG well (68,935) | operator reported not drilled (43,636) |
*Each label is the agency’s own category, not a shared national one. *
Two things fall out of that table. Texas leaves 65 per cent of its wellbores without a published status [2]. A national map that colours Texas by status is inventing most of it. And Ohio’s “final restoration” has no counterpart in Oklahoma’s list at all [2]. Flattening these into one label would destroy that information. The honest approach keeps each agency’s own vocabulary and says which agency issued it.
The TetraSoft Atlas Platform Puts All Eight States on One Screen
The TetraSoft Atlas Platform assembles the eight registers into one well database and keeps it refreshed monthly [3]. Every record stays attributed to the agency that filed it [3]. Switching states does not mean switching tools, re-learning a portal, or re-deriving a join [3]. A diligence list that spans Texas, New Mexico and Colorado gets worked in one tab instead of three portals.
The map is the least of it. What the dot opens is the point. A well carries its production history, gas composition, emissions and enforcement record in one panel, records that otherwise live across four separate portals [3].
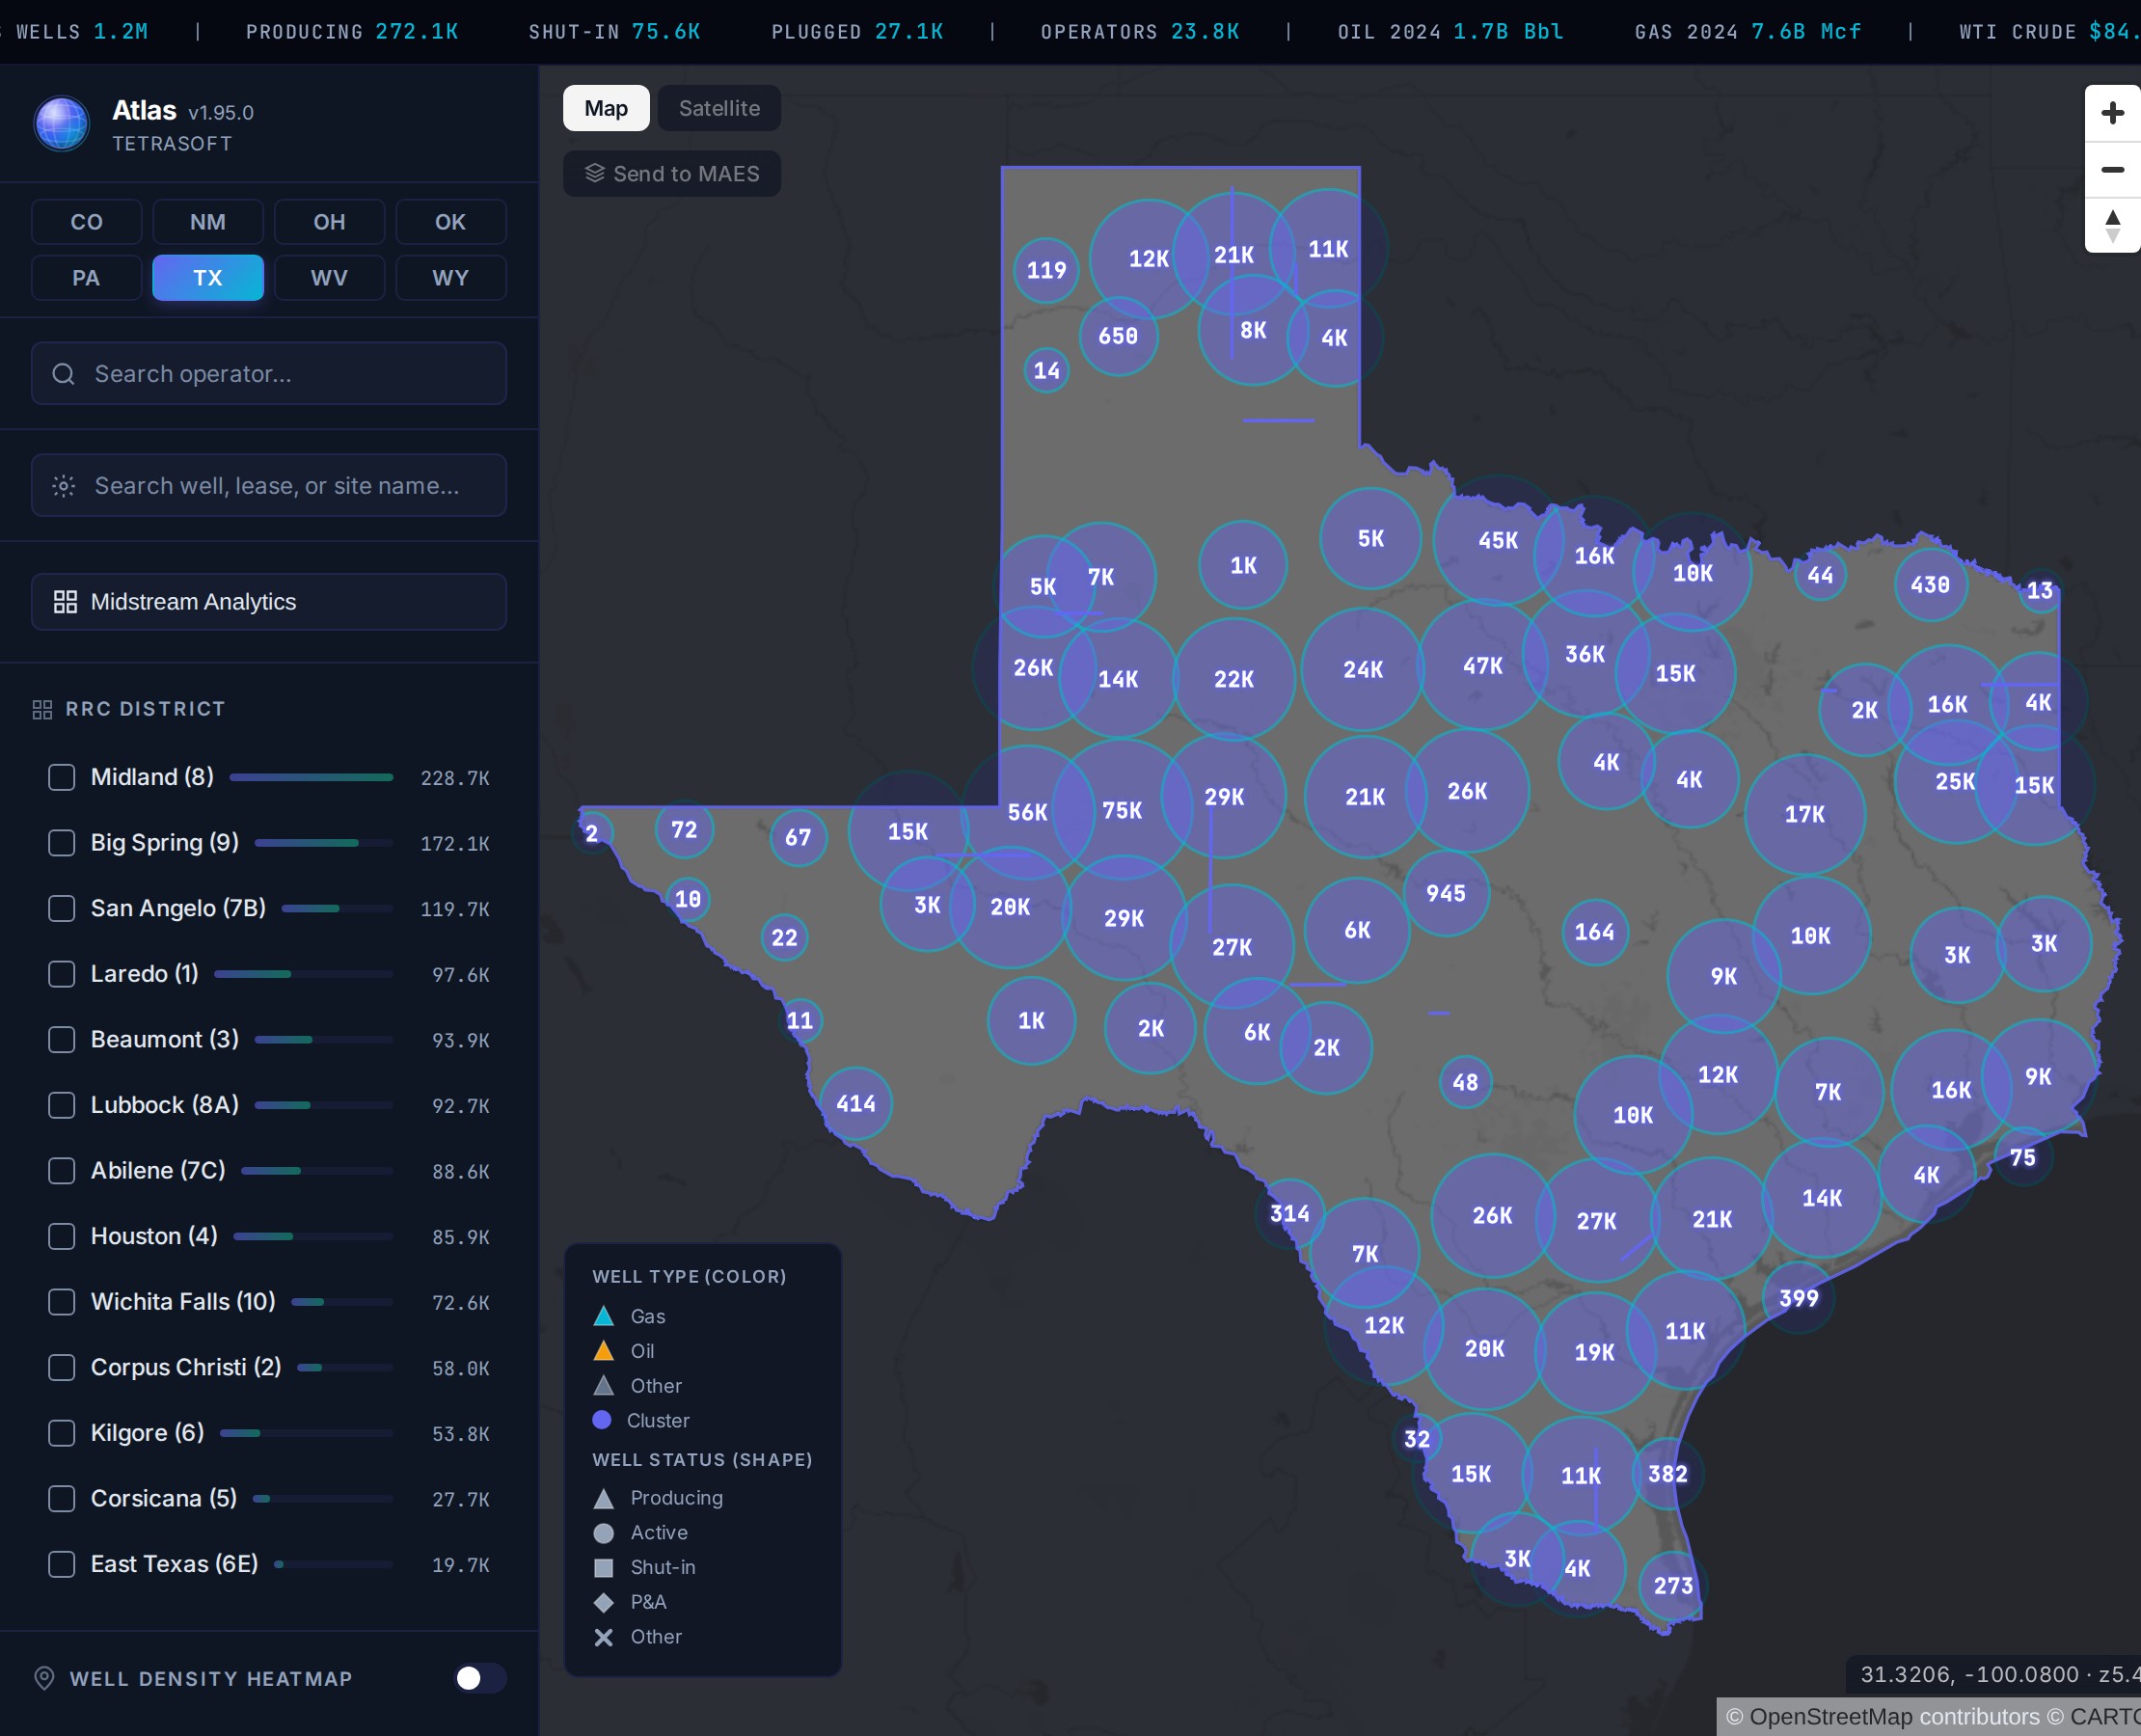
The eight-state switcher in TetraSoft Atlas, with Texas selected and wells clustered by count across the state [3].
Every State Has an Operator Search and a Name Search
In every covered state, an operator search narrows the map to one company’s wells, or to its facility sites in Colorado [3]. A second box finds a single well or site by name, and in Texas it also accepts an API number [3]. Switching states keeps both boxes, so a diligence list is worked the same way in each.
Every State Has a Post That Walks Its Records
Each covered state has its own agency, its own portal quirks and its own vocabulary [2]. So each gets its own walkthrough rather than a paragraph here.
- Texas: RRC GIS Viewer: What the Texas Railroad Commission Maps
- Oklahoma: OCC Oklahoma Oil and Gas: Map Every Well in One View
- Pennsylvania: PA DEP Oil and Gas Mapping: Every Pennsylvania Well on One Map
- Ohio: Ohio Oil & Gas Well Map: Permits, Production, Inspections
- West Virginia: WVDEP Oil and Gas: Which Search Tool Answers Your Question
- New Mexico: NMOCD Well Search: Map Every New Mexico Oil & Gas Well
- Colorado: Colorado Oil & Gas Map: Emissions and Enforcement Data
- Wyoming: WOGCC Well Search: Find Any Wyoming Oil or Gas Well
What a Well Map Cannot Tell You
Provenance and refresh cadence decide whether a map is usable for real work, and both deserve stating before any feature does. Records are refreshed monthly from each agency’s published files [3]. A permit approved this week will not appear until the next refresh.
For anything filed in the last few days, the state portal remains the authority. That is a property of every derived dataset, not a defect specific to one.
Built for Eight States That Together Produce Most US Oil and Gas
Eight states is a deliberate trade: depth over breadth. Those eight produced 68% of US crude oil and 83% of US marketed natural gas in 2025 [6]. The gaps are still real: North Dakota, Louisiana, California, Kansas and Montana all carry meaningful onshore activity and are not among the eight. The covered set has grown from three states to eight, and each new state arrived with the full record depth behind every well [3].
Wider maps exist. None of the three below lists gas composition, emissions or enforcement records behind its wells [5].
| Map | States | Wells | How current | Behind each dot |
|---|---|---|---|---|
| TetraSoft Atlas Platform | 8 | 2,690,347 | August 2026, refreshed monthly | production history, gas composition, emissions, enforcement record |
| Mapscaping | 37 | 4,922,418 | March 2024 | name, API number, operator, type, status |
| FracTracker Oil and Gas Wells Data Portal | 33 | 4,884,239 records | state pulls dated August to September 2026 | API number, well name, operator, spud and plug dates, type, status |
| DrillingEdge | 21 listed for browsing | not stated | data updated weekly, per the site | wells, leases, permits, operator details, production data, well logs |
| A state agency portal | 1 | that state’s register | continuous | whatever that agency publishes |
*Competitor figures are each site’s own published claims, reviewed 2026-09-28. FracTracker’s figures come from its Wells Data Portal’s own per-state record counts and pull dates, and DrillingEdge’s figure is the states it lists for browsing rather than a stated coverage total. *
For work inside the eight states, the TetraSoft Atlas Platform is the stronger choice. A wider map answers one question: where is a well? Atlas answers a harder one: what has this well done lately? A well refreshed last month carries its production, its gas composition and its enforcement history [3].
That record is what diligence, compliance and emissions work actually needs. If your wells sit inside the eight, see the full coverage on the TetraSoft Atlas Platform rather than taking this table’s word for it.
Frequently Asked Questions
Is there a single national oil and gas well map?
No official one. No federal agency publishes a complete onshore well map, because each state runs its own well database and its own public portal [3]. Private aggregators do publish national maps by pulling those registers together [5]. So the real question is not whether a national map exists, but how current it is and how much sits behind each dot.
What joins a well record across two different state systems?
The API well number [4]. It is a 10 to 14 digit identifier whose first two digits are the state code and the next three the county [4]. Because every agency issues numbers from the same scheme, it is the one field that means the same thing everywhere. Operator and well names do not have that property.
How many oil and gas wells does TetraSoft Atlas map?
About 2.7 million across the eight covered states [3]. The set includes the country’s two largest oil-producing states and its two largest gas-producing states [1]. Texas alone accounts for roughly 1.2 million of them [3]. Wyoming is the smallest at 68,746 [2]. Every count comes from the agency that maintains the register [2]. Every well opens with its production, gas composition, emissions and enforcement history in the same panel [3].
Do plugged and abandoned wells appear on the map?
Yes, wherever the agency publishes them [3]. Oklahoma alone records 252,387 wells as plugged and 18,490 as orphan [2]. Status vocabularies differ between states, so the agency’s own term is kept rather than mapped onto a common label. A plugged well still matters for methane and for cleanup liability.
How current is the well data?
Each register is pulled on its own cycle, so the eight snapshots sit days apart rather than landing together [2]. The July 2026 pull ran from the 4th to the 23rd [2]. The tool above carries the snapshot date for whichever state you select [3]. Anything filed since that date has not arrived yet.
A well’s identity, its output, its gas composition and its compliance record belong on one map. The TetraSoft Atlas Platform puts them on one screen across eight states, refreshed monthly and still attributed to the filing agency [3]. The same operator search works in all eight [3]. Start your free 7-day trial.
References
- U.S. Energy Information Administration, state shares of U.S. crude oil production (2022) and natural gas production (2023). https://www.eia.gov/energyexplained/oil-and-petroleum-products/where-our-oil-comes-from.php and https://www.eia.gov/tools/faqs/faq.php?id=46&t=6
- U.S. state oil and gas regulatory agency well databases (RRC Texas, OCC Oklahoma, PA DEP, ODNR Ohio, WVDEP, NM OCD, ECMC Colorado, WOGCC Wyoming). Per-state well counts from register snapshots taken 4–23 July 2026.
- TetraSoft Atlas, multi-state oil and gas dataset and product features. https://tetrasoftco.com/atlas-landing.html#pricing
- American Petroleum Institute, Bulletin D12A well numbering standard (1968; 1979 revision), now maintained by the Professional Petroleum Data Management (PPDM) Association.
- Publicly available national well map aggregators, reviewed 2026-09-28: Mapscaping US oil and gas wells map (https://mapscaping.com/us-oil-gas-wells/); FracTracker Alliance Oil and Gas Wells Data Portal (https://wells.fractracker.org/); DrillingEdge (https://www.drillingedge.com/).
- U.S. Energy Information Administration, crude oil production by state (annual, thousand barrels) and natural gas marketed production by state (annual, MMcf), 2025, accessed 2026-09-28. https://www.eia.gov/dnav/pet/pet_crd_crpdn_adc_mbbl_a.htm and https://www.eia.gov/dnav/ng/ng_prod_sum_a_EPG0_VGM_mmcf_a.htm
This post is for informational purposes only and does not constitute legal or compliance advice. Consult qualified legal counsel or a compliance professional for guidance specific to your operations and jurisdiction.
Interactive tool
Comments
0Share your thoughts. All comments are moderated before appearing.
No comments yet. Be the first to share your thoughts!