Oil and gas production data decides what a well is worth, how fast it declines and what it emits. Oil well production data means the oil, gas and water volumes an operator reports to the state for each well or lease.
This guide maps where that data lives in eight states and how to look up oil production by well, operator and county. It then shows how far back each state’s history runs, and how the same volumes feed a methane estimate. Every record discussed here sits beside its well in TetraSoft Atlas, our subscription platform that joins well, production, emissions and enforcement records.
Quick Answer: Oil and gas production data is kept by each state’s regulator, except in Oklahoma, where the Oklahoma Tax Commission keeps it [1]. Texas reports by lease and most other states by well; Pennsylvania’s conventional wells and Ohio’s and West Virginia’s non-horizontal wells report once a year. Texas’s online production records start in January 1993 [2]. TetraSoft Atlas puts production records for seven of its eight states on one map, linked to each well or site.
Where Oil and Gas Production Data Comes From, State by State
Oil and gas production data comes from the agency each state assigns to collect it, and the unit each record covers differs by state. For each of the eight states, the table gives the agency, what one record covers, how often it is filed and where to look. A lease is the tract covered by one mineral lease, and it can hold several wells.
| State | Who collects it | One record covers | How often | Where to look |
|---|---|---|---|---|
| Texas | Railroad Commission of Texas | A lease | Monthly | Production Data Query |
| Oklahoma | Oklahoma Tax Commission | A production unit (PUN) | Monthly, filed by the first purchaser | OTC gross production |
| New Mexico | Oil Conservation Division | A well, by pool | Monthly (form C-115) | OCD data and statistics |
| Colorado | Energy and Carbon Management Commission | Each completed formation in a well | Monthly (Form 7) | ECMC Form 7 |
| Wyoming | Oil and Gas Conservation Commission | A well | Monthly (Form 2) | WOGCC resources |
| Pennsylvania | Department of Environmental Protection | A well | Monthly if unconventional, yearly if conventional | DEP oil and gas reports |
| Ohio | Department of Natural Resources | A well | Yearly; quarterly for horizontal wells | ODNR production |
| West Virginia | Department of Environmental Protection | A well | Yearly; quarterly for H6A horizontal wells | WVDEP production reporting |
Reporting unit and frequency by state, from each agency’s rules and reporting pages, read September 23, 2026.
For Oklahoma oil and gas production data, the state sends readers to a different agency entirely. The Oklahoma Corporation Commission’s data page says: “Looking for crude oil or natural gas production data? The Oklahoma Tax Commission is the official recordkeeper for the state.” [1] Oklahoma’s gross production tax “is remitted to the Oklahoma Tax Commission (OTC) on a monthly basis by the first purchaser.” [3] The record follows the sale, not the wellhead.
Oklahoma production stays with the Tax Commission’s lease-level PUN data, while Atlas maps Oklahoma’s wells, injection wells and earthquakes.
How Texas Leases Work, and How to Get Per-Well Numbers
Texas is the biggest exception to per-well reporting. The Railroad Commission’s own guidance says: “In Texas, production is reported by each oil and gas lease rather than individual well.” [4] An oil lease can hold many wells, so any Texas per-well figure is an allocation of the lease total [4]. The RRC Wellbore Query: How to Search Texas Well Records Online post shows how to find a well’s lease
Texas splits its records between gas wells and oil leases. The PDQ guidance adds: “Gas leases contain one gas well per lease.” [4] A Texas gas well’s reported production is therefore already that well’s own.
Oil is the hard case. RRC’s reporting guide says: “The monthly PR is a combined sum of all wells on a designated RRC oil lease.” [5] Each oil lease carries a five-digit number and each gas well a six-digit number [5]. Look a well up by its API number in Wellbore Query to get its lease number, then open that lease in PDQ [4].
For a multi-well oil lease, RRC’s monthly volumes are lease totals. It does publish each well’s test rate: the W-10 test “is the basis for calculating the gas-oil ratio of the well.” [6] Those test files are free downloads on the RRC data sets page [7].
A well’s share of its lease can be estimated by weighting the lease total by each well’s latest test rate. The only measured monthly volume for one oil well is the operator’s own meter. The W-10 gas-oil ratio is also the per-well ratio the methane method below asks for.
Reporting Deadlines Decide How Current the Data Is
A monthly report still arrives a month or more after the gas is produced. New Mexico oil production data comes from form C-115, due “on or before the 15th day of the second month following the month of production.” [8] Colorado’s Form 7 “is due forty-five (45) days following the end of the month that is being reported.” [9]
Annual reporters lag much further. Ohio requires owners of wells other than horizontal wells to file production “on or before the thirty-first day of March” for the preceding calendar year [10].
West Virginia sets the same March 31 deadline for its annual report, with quarterly reporting for horizontal H6A wells [11]. Pennsylvania’s conventional wells file one annual report per well, due “on or before February 15 of each year.” [12] Gas such a well produced in January is therefore more than a year old before it can appear in DEP’s data.
Produced or Sold: What a Reported Volume Counts
Most states’ figures count what the well produced, not only what was sold. Texas operators must “Report all gas produced regardless of disposition,” including “vented or flared gas.” [13] Pennsylvania asks that “All production volumes must be reported on a wellhead basis if available.” [14]
Oklahoma is the exception. Its official volumes come from gross production tax reports, which record “The month and year the product reported was sold.” [15] An Oklahoma figure is closer to a sales volume than to wellhead production.
Where a state reports production, the record also reports disposition: how much gas was sold, used on site, flared or lost. Colorado’s Form 7 balances gas with the equation “Produced = Flared + Used + Shrinkage + Sold.” [9]
Shrinkage is the volume lost as gas is processed, before it is sold. Every cubic foot must land somewhere. Those disposition lines are the first place to look for gas that never reached a sales line. A sales figure alone understates what the well produced by exactly the gas a methane estimate is about.
How to Find an Oil Well’s Production History
Finding a well’s production history takes three steps: identify the well, find the record that holds it, then read its grain. The API number is the safest key. The grain is what one reported number covers: a well, a lease or a production unit.
Look Up Production by API Number, Operator or County
You can look up production by one well’s API number, or by operator or county for a wider view. An API number is the unique identification code assigned to each oil and gas well drilled in the United States. The API Well Number Lookup: What It Is and How to Read One post decodes its digits. In Texas, Wellbore Query turns an API number into a lease number, and PDQ returns that lease’s production [4].
In TetraSoft Atlas, oil production by well sits in the well’s own panel on the map (a site panel in Colorado). Atlas’s Texas search accepts an API number or a lease name. In the other seven states, you find a well (or a Colorado site) by its name or on the map.
| State | Production grain in TetraSoft Atlas | What one figure covers |
|---|---|---|
| Texas | Monthly, lease-allocated | The lease total divided by the wells on the lease |
| Oklahoma | Not in Atlas yet | Use the Tax Commission’s data by production unit (PUN) |
| New Mexico | Monthly | One well |
| Colorado | Monthly | One well site |
| Wyoming | Monthly | One well |
| Pennsylvania | Monthly and annual | One well |
| West Virginia | Monthly | One well |
| Ohio | Annual | One well, with no monthly figures |
Production grain by state in TetraSoft Atlas, read from the Atlas production code, September 28, 2026.
Texas oil and gas production data is reported by lease, so Atlas splits each monthly lease total equally across the wells on that lease. A Texas gas well is its own lease, so its figure is that well’s own. Treat a multi-well oil lease’s per-well figure as a share, not a meter reading.
Oil production by operator or by county takes a different query. Texas’s Production Data Query can open its general query by lease, operator, field, district or county [16]. Each other state needs its own portal and its own query. One map beats eight portals here.
In TetraSoft Atlas, an operator search filters the map to one operator’s wells in all eight states, or its sites in Colorado. In Texas, New Mexico, Ohio, Pennsylvania, West Virginia and Wyoming, the Data Analysis view ranks the top operators by lifetime gas produced. Each ranked operator shows its well count and its oil or liquids volume. The same view lists oil and gas production by county and charts statewide totals by year.
Historical Oil Production Data: How Far Back It Goes
How far back historical oil production data goes depends on the state. Texas’s Production Data Query holds production from January 1993 onward [2]. Atlas’s Texas well panel loads the full monthly history on file, back to 1993, with each month’s gas-to-oil ratio. For a decline curve, that full series matters more than the latest month.
Atlas covers eight states that produced 68 percent of US crude oil and 83 percent of US marketed gas in 2025 [17]. They include Texas and New Mexico, the two largest oil producers, and Pennsylvania, the second-largest gas producer [17]. That puts eight agencies’ formats, units and reporting schedules on one map. Atlas refreshes every state monthly, and we are expanding it to every US state [18].
Unlike an enterprise data contract, Atlas needs no sales call: you sign up yourself and start a 7-day trial with no credit card [18]. The Oil and Gas Data Analytics Platforms: How to Choose One guide covers how to test any platform that holds these records.
How Production Data Feeds a Methane Estimate
Production data feeds a methane estimate by supplying the activity side of the calculation: the volumes an emission rate is multiplied by. The federal method is Subpart W of 40 CFR Part 98, the Code of Federal Regulations part that holds EPA’s greenhouse gas reporting rule [19]. Associated gas is the gas produced alongside oil. Subpart W’s associated gas method uses each well’s gas-to-oil ratio and the oil produced while gas was vented [19].
EPA’s 2024 amendments require “reporting of emissions and activity data for each individual well instead of in the prior aggregations (e.g., by sub-basin).” [20] A sub-basin is Subpart W’s grouping of wells by county and formation type [21]. That well-level reporting starts with reporting year 2025, if the program continues.
EPA proposed on September 16, 2025 to suspend reporting for the remaining Subpart W segments until reporting year 2034 [22]. As of September 2026 that proposal has not been finalized. The GHGRP Subpart W Reporting in 2026: What Is Still Required post tracks which of these obligations apply this year. The What Is Subpart W Suspension? State Rules Still Apply post covers the state obligations that stay in force either way.
Venting Is Now the Exception, but the Calculation Still Applies
Routine venting and flaring of associated gas is prohibited for all wells in New Mexico and Colorado. Colorado’s rule is blunt: “Venting and Flaring, except as specifically allowed in this Rule 903, are prohibited.” [23] New Mexico’s rule states that venting or flaring during production “that constitutes waste as defined in 19.15.2 NMAC is prohibited.” [24]
Under EPA’s OOOOb standard, associated gas from new oil wells must be sent to sales, used on site, put to another use or reinjected [25]. An April 9, 2026 final rule amended it, extending some temporary flaring of associated gas from 24 to 72 hours [26]. EPA announced in March 2025 that it would reconsider the 2024 rule, so OOOOb is still being amended [26].
Gas is still vented during malfunctions, emergencies and other permitted exceptions, and those events are what the method estimates. The associated gas method takes four numbers and returns metric tons of methane. The gas-to-oil ratio (GOR) is the standard cubic feet of gas produced per barrel of oil [19]. A standard cubic foot is measured at 60 °F and 14.7 psia [19].
Where a continuous meter measures the gas sent to a vent, the rule requires that measured volume instead [19]. The four steps are the fallback for wells without one.
- Multiply the well’s GOR by the oil produced during the periods its associated gas was vented or flared.
- Subtract the gas sent to sales and the gas used on site in those periods, such as engine fuel; do not subtract flared gas.
- Send any flared share to the separate flare method, and multiply the vented volume by the methane mole fraction, the share of the gas molecules that are methane.
- Multiply by 0.0192 kg per standard cubic foot of methane and divide by 1,000 for metric tons.
The rule calculates carbon dioxide the same way, with its own mole fraction and 0.0526 kg per standard cubic foot [19].
The rule allows the GOR of “a cluster of wells in the same sub-basin category” “If GOR from each well is not available.” [19] A cluster ratio is permitted, but it averages away the well that vents most. Gas that is flared instead of vented follows a separate destruction-efficiency method, covered in Oil and Gas Flaring: What Flares Actually Destroy [19].
Methane Content Moves One Well’s Estimate by Half Again
Methane content alone moves one Texas well’s vented-methane estimate by half again, at identical oil and GOR inputs. Gas composition, the mix of methane, heavier hydrocarbons, carbon dioxide and nitrogen, sets the methane mole fraction in step 3. The rule asks for “an annual average gas composition based on your most recent available analysis of the sub-basin category or facility.” [19] The chart shows how far that value moves, from 11,058 US Geological Survey hydrocarbon gas samples across the eight states [27].
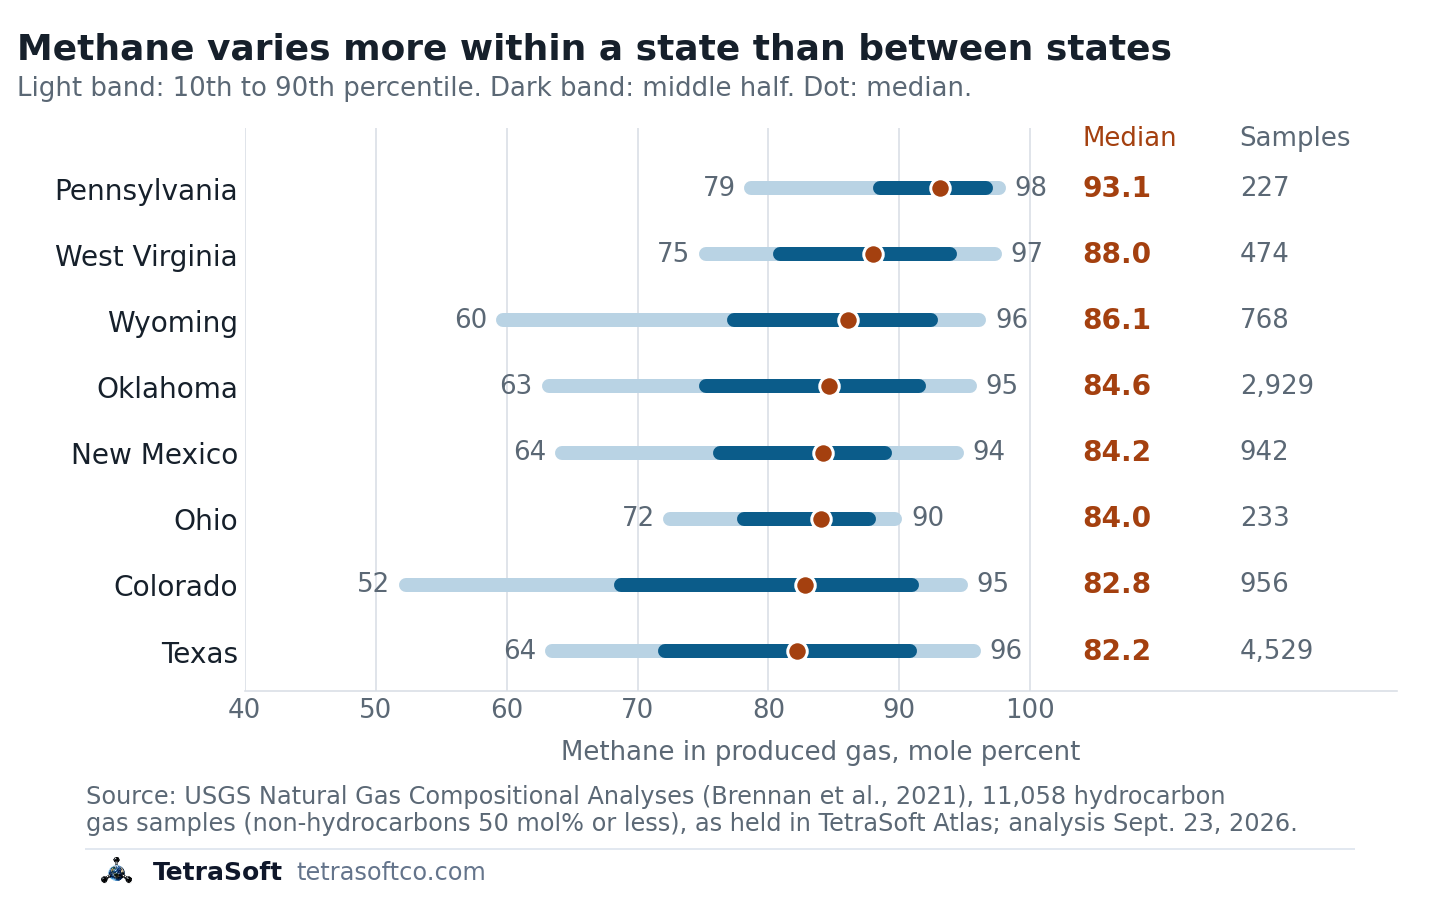
Methane content of produced gas by state: 10th to 90th percentile, middle half, median and sample count. [27]
The samples are public. They come from a USGS compositional dataset, filtered to hydrocarbon gas [28]. We dropped 632 of 11,690 samples whose carbon dioxide, nitrogen, helium and other non-hydrocarbons exceed 50 mole percent [27]. Those samples come from carbon dioxide or nitrogen reservoirs, not the gas an oil well vents.
State medians span only 11 points, while the band inside Colorado spans 42 [27]. A state average hides most of the difference that matters for one well.
The table runs the four steps for a Texas well at the state median methane content of 82.2 mole percent. The same well at the Texas 10th percentile, 63.5 percent, vents 43.9 metric tons, and at the 90th percentile, 95.7 percent, it vents 66.1 [27].
| Step | Input | Result |
|---|---|---|
| 1. Gas produced | 3,000 bbl of oil at a GOR of 1,200 scf/bbl | 3,600,000 scf |
| 2. Less gas sold or used | none in this example | 3,600,000 scf vented |
| 3. Methane volume | 82.2% methane | 2,959,200 scf |
| 4. Methane mass | 0.0192 kg per scf | 56.8 metric tons |
The calculator below runs those steps with the methane fraction preset to your state’s median. Replace the preset with your own gas analysis. Most public samples are old: 91% of the samples in the chart were taken before 2000 [27]. Treat a preset as a screen rather than a substitute for your own analysis.
The USGS gas samples in the chart come from the copy TetraSoft Atlas holds [27]. In all eight states, Atlas’s statewide analysis view has a gas composition tab.
Want each well’s production and nearby gas samples on one map? Try TetraSoft Atlas free for seven days.
Production data cannot show emissions from equipment behaving abnormally, and measurement studies put a size on that gap. A teragram is one million metric tons. Alvarez and colleagues estimated 2015 US oil and gas methane at 13 ± 2 teragrams a year, about 60% above EPA’s national inventory [29]. They wrote that the gap arises “likely because existing inventory methods miss emissions released during abnormal operating conditions.” [29]
The gap between reported inventories and measured emissions is partly a modelling problem, which is what MAES does. MAES, the Mechanistic Air Emissions Simulator, “is a simulation tool developed at Colorado State University” to estimate emissions from oil and gas facilities [30]. Its development drew on research that includes the EEMDL initiative of CSU and UT Austin, and TetraSoft offers it through a special license with CSU [31].
A mechanistic model simulates how each piece of equipment behaves, second by second [30]. MAES turns those estimates into “a probability distribution of expected emissions,” which gives the expected range for a site [30]. Measurements above that range point to abnormal events, such as equipment failures [30].
Production volumes and gas composition are the inputs such a model needs. A measurement-informed inventory needs field measurements as well as the model [30]. TetraSoft builds that inventory for you: with your measurement campaign data, MAES “can incorporate it to produce a Measurement-Informed Inventory (MII).” [31]
No measurements yet? “No field measurement hardware is required for a baseline simulation.” [31] Either way, the result is a range with P5, mean and P95 values rather than a single number [31].
Frequently Asked Questions
Is oil and gas production data public?
Yes, in all eight states production data is public and free to look up. Texas says its downloadable data sets are available free of charge [7]. The catch is format: each agency publishes in its own layout, and Texas leaves the conversion to the user [7].
What units is oil and gas production reported in?
Oil, condensate and water are reported in barrels, and gas in thousand cubic feet (mcf) [32]. West Virginia states its units as “Gas - MCF (1,000 cubic feet), Oil, Condensate, Water - Barrels (42 gallons).” [32] Gas volumes are stated at standard conditions, so two states’ mcf figures compare directly. Check whether condensate sits inside the oil column before adding states together.
Why do two sources give different production for the same well?
Two sources usually differ because they count a different unit or allocate a lease differently. A Texas figure split across a lease’s wells will not match an operator’s own metered well volume. Texas also reports condensate and casinghead gas separately from crude oil and gas-well gas, so a total that omits them looks low [33].
Can you look up oil production by API number?
Yes, in Texas you look the API number up in Wellbore Query to get the lease number, then open that lease in PDQ [4]. TetraSoft Atlas’s Texas well search also takes an API number and shows the well’s production in its panel. Outside Texas and Oklahoma, an API number leads to one well’s own record.
How far back does historical oil production data go?
It depends on the state. Texas’s Production Data Query holds production from January 1993 onward [2]. Annual reporters, such as Ohio’s non-horizontal wells and Pennsylvania’s conventional wells, add one year at a time after each filing deadline.
Have measurement campaign data, or want a baseline first? Contact us and we will build your Measurement-Informed Inventory with MAES.
This post is for informational purposes only and does not constitute legal or compliance advice. Consult qualified legal counsel or a compliance professional for guidance specific to your operations and jurisdiction.
References
- Oklahoma Corporation Commission, Oil and Gas Data Files, accessed September 23, 2026
- RRC Interactive, Oil and Gas Production Data Home, currently loaded production data range, viewed September 28, 2026
- Oklahoma Tax Commission, Gross Production, accessed September 23, 2026
- Railroad Commission of Texas, Production Data Query System (PDQ) FAQs, accessed September 22, 2026
- Railroad Commission of Texas, Section I, Forms Required for Reporting Production, July 2021
- Railroad Commission of Texas, Form W-10 Instructions, accessed September 23, 2026
- Railroad Commission of Texas, Data Sets Available for Download, accessed September 22, 2026
- New Mexico Oil Conservation Division, C-115 Instructions, accessed September 23, 2026
- Colorado Energy and Carbon Management Commission, Monthly Report of Operations, Form 7 Specifications, accessed September 23, 2026
- Ohio Revised Code 1509.11, Statement of production of oil, gas and brine
- West Virginia Department of Environmental Protection, Office of Oil and Gas, Annual Production Reporting Requirements, accessed September 23, 2026
- 25 Pa. Code § 78.121, Production reporting, accessed September 23, 2026
- Railroad Commission of Texas, Form PR Instructions, January 25, 2022
- Pennsylvania Department of Environmental Protection, Conventional Wells Production and Waste Reporting Guide, accessed September 23, 2026
- Oklahoma Administrative Code 710:45-5-1, Gross production reports, accessed September 23, 2026
- RRC Interactive, PDQ General Query Criteria form (initial view options), viewed September 28, 2026
- U.S. Energy Information Administration, crude oil and natural gas marketed production by state, annual 2025, accessed September 23, 2026
- TetraSoft Atlas landing page, tetrasoftco.com/atlas-landing.html, accessed September 23, 2026
- 40 CFR 98.233, Calculating GHG emissions, Subpart W (Petroleum and Natural Gas Systems)
- 89 FR 42062, Greenhouse Gas Reporting Rule: Revisions and Confidentiality Determinations for Petroleum and Natural Gas Systems, May 14, 2024
- 40 CFR 98.238, Definitions, Subpart W (Petroleum and Natural Gas Systems)
- 90 FR 44591, Reconsideration of the Greenhouse Gas Reporting Program, proposed rule, September 16, 2025
- Colorado Energy and Carbon Management Commission, Rule 903, 900 Series Rules, effective April 30, 2025
- New Mexico Administrative Code 19.15.27, Venting and Flaring of Natural Gas, effective May 25, 2021
- 40 CFR 60.5377b, Standards for associated gas from oil wells (NSPS OOOOb)
- 91 FR 18056, Reconsideration of the oil and natural gas standards, final rule, April 9, 2026
- TetraSoft analysis of USGS hydrocarbon gas composition samples for eight states, September 23, 2026
- Brennan, S.T., Rivera, J.L., Creitz, R.H., Varela, B., and Park, A.J., 2021, Natural Gas Compositional Analyses Dataset of Gases from United States Wells, U.S. Geological Survey data release, doi:10.5066/P9TR93E3
- Alvarez, R.A., et al., 2018, Assessment of methane emissions from the U.S. oil and gas supply chain, Science, 361(6398), 186-188, doi:10.1126/science.aar7204
- Colorado State University METEC, Measurement-Informed Inventory, accessed September 23, 2026
- TetraSoft, MAES Platform product page, accessed September 23, 2026
- West Virginia Department of Environmental Protection, Office of Oil and Gas, Database Information, accessed September 23, 2026
- Railroad Commission of Texas, Texas Monthly Oil and Gas Production, accessed September 23, 2026
- TetraSoft Atlas, Texas dataset from Railroad Commission of Texas records
Interactive tool
Vented associated gas methane
Enter the oil a well produced while its gas was vented. The Subpart W method returns the methane vented, and the band below shows how far your state's gas composition can move it.
Methane vented
56.8 metric tons
From 3,600,000 scf of vented gas
- Gas produced while venting
- 3,600,000 scf
- At Texas's 10th-percentile gas (63.5%)
- 43.9 t
- At Texas's 90th-percentile gas (95.7%)
- 66.1 t
40 CFR 98.233 equations W-18, W-35 and W-36; USGS Natural Gas Compositional Analyses (Brennan et al., 2021), hydrocarbon gas samples, read September 23, 2026. Venting only: gas routed to a flare follows the destruction-efficiency method in 98.233(n). State presets are a screen; the rule asks for your most recent gas analysis.
Comments
0Share your thoughts. All comments are moderated before appearing.
No comments yet. Be the first to share your thoughts!