Texas keeps about 1.2 million oil and gas wellbores on Railroad Commission record, past and present [1]. The Commission’s free Public GIS Viewer shows where a well is [2]. It has no layer for what the well produced, who inspected it, or what its gas contains [2].
Production and inspections sit in separate Commission files, and production is filed by lease, not by well [3]. One well means a wellbore query for its lease number, a lease production query and an inspection lookup. Many wells mean bulk downloads you convert and join by API number yourself.
TetraSoft Atlas, our subscription platform, has already done that work: production, inspections and gas analysis open from the well on the map [1]. This guide shows how to read one well’s full record on the map, and what the free viewer costs you in time.
Quick Answer: Texas has about 1.2 million oil and gas wellbores on Railroad Commission record, past and present, across 13 district codes [1]. The Commission’s free viewer maps where they are; production, permits and inspections sit in separate files you download and join yourself [4]. TetraSoft Atlas maps about 1 million located Texas wells with production and inspections one click away [1]. It adds gas analysis on 3,737 wells, pipelines alongside, and seven more states, expanding to every US state [1].
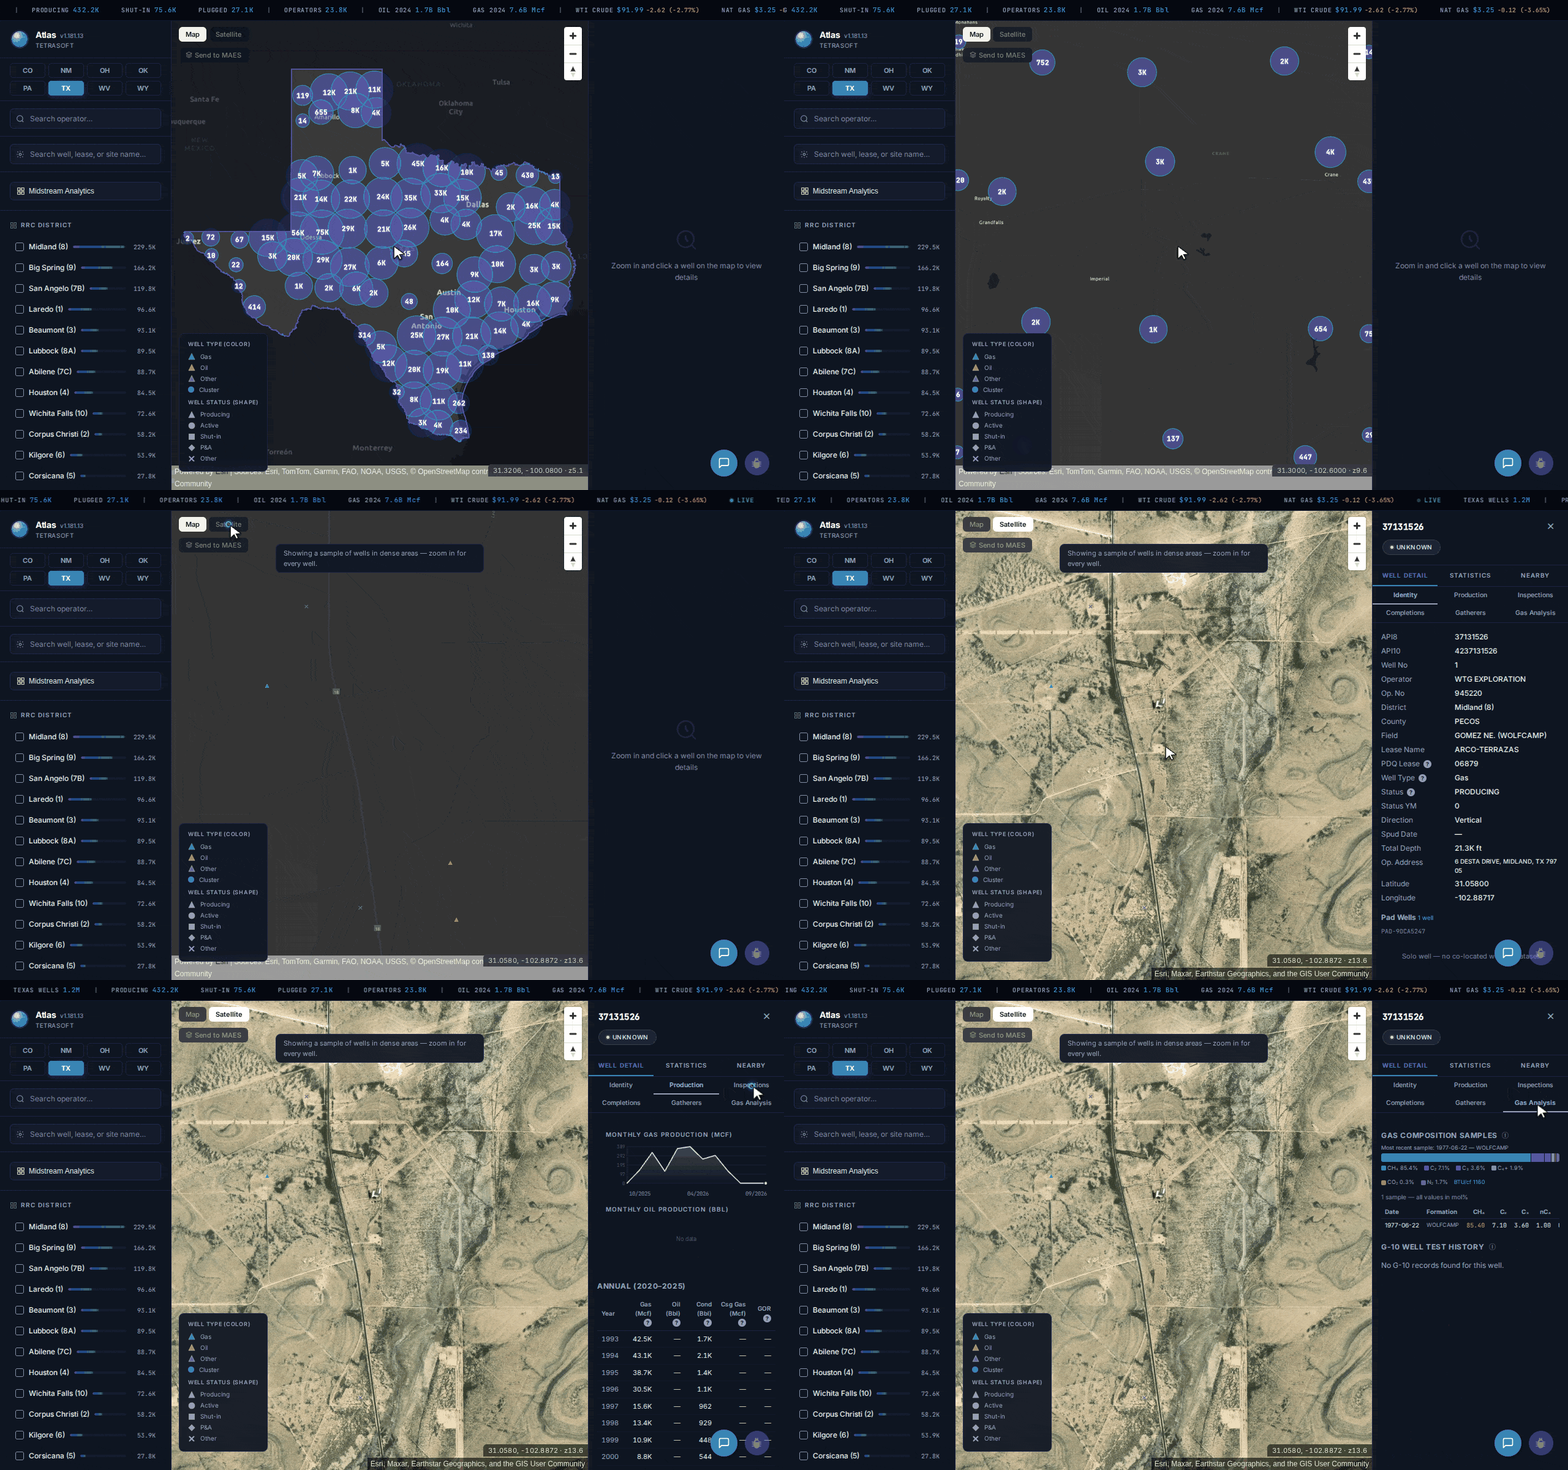
From statewide clusters to one Permian well’s production, inspections and gas composition, in one Atlas map. [1]
- How to Search a Texas Oil and Gas Map by District, Operator and Well
- How Texas Identifies a Well: API Number, Lease and District
- Open One Well and Read Its Full Record
- See Where the Horizontal Laterals Actually Run
- What TetraSoft Atlas Shows Beyond Texas Wells
- TetraSoft Atlas vs the Free RRC GIS Viewer: Which Texas Map Fits
- Where a Texas Map Goes Wrong on Production
How to Search a Texas Oil and Gas Map by District, Operator and Well
TetraSoft Atlas opens Texas as one map of the Commission’s located wells, drawn as count clusters that resolve to single wells as you zoom [1]. The left panel lists the 13 Railroad Commission district codes with their well counts, led by Midland (8) at about 229,500 wells [1]. Tick a district in Atlas and the wells on the map narrow to it [1].
Zoomed in, Atlas colors each well by type and shapes it by status, so producing triangles, shut-in squares and plugged diamonds read apart [1]. Atlas filters narrow the wells to oil or gas, horizontal or vertical, injection and disposal wells, or wells with a lab gas sample [1]. Switch the Atlas basemap to satellite, and the same wells sit over aerial imagery of their pads and roads [1].
Atlas has two search boxes for the other way in [1]. One filters the wells to an operator name; the other takes a well, lease or site name and jumps the map there [1]. If you are starting from a number instead, the API Well Number Lookup: What It Is and How to Read One guide explains the Texas digits.
How Texas Identifies a Well: API Number, Lease and District
Three numbers unlock almost any Texas well record: its API number, its lease number and its district. A Texas API number is the state code 42, then a three-digit county code and a five-digit number for the wellbore [5]. The Commission’s record search drops the 42: “use only the 3 digit county code followed by the 5 digit unique number assigned to the wellbore.” [5] Either the lease number or the API number alone should be enough to find a well’s records, the Commission says [5].
Districts matter too, because the Commission splits its production ledger downloads across 14 district files [4].
Production follows the lease rather than the well [3]. Key an API number into the Commission’s wellbore query and it returns the lease number, which is what the Production Data Query takes [3]. Gas leases contain one gas well per lease, so a gas lease’s production is that well’s own [3]. An oil lease can hold numerous wells, so a lease total read as one well’s output overstates that well.
Completion packets received by the Commission after February 2011 are filed online, while older records are scanned images [5]. An older well’s completion history can therefore arrive as a PDF rather than as data.
In TetraSoft Atlas, the API number, lease name and district sit together on the well’s identity tab [1]. A lease name typed into the search box lists the wells on matching leases, and picking one jumps the map to it [1]. That turns a lease name from a royalty statement into a place you can see.
Open One Well and Read Its Full Record
Every tab loads from one click [1]. Clicking a well opens its record beside the map, in tabs for identity, production, inspections, completions, gatherers and gas analysis, plus injection on injection wells [1]. Take the ARCO-TERRAZAS 1, a producing Wolfcamp gas well in Pecos County, Midland district, operated by WTG Exploration [1]. Its production tab runs from 1993 to 2026, with reported gas production falling from 43,092 Mcf in 1994 to 2,399 Mcf in 2025 [1].
The same record carries 12 Commission inspections from 2017 to 2025 and three notices of violation, each flagged as not major [1]. Its gas tab holds a 1977 sample from the USGS national gas composition dataset [6]. The sample reads 85.4 percent methane, with a heating value of 1,160 BTU per cubic foot [1]. Three decades of decline, an inspection history and the gas itself, from one click, is the part the Commission’s free viewer does not return.
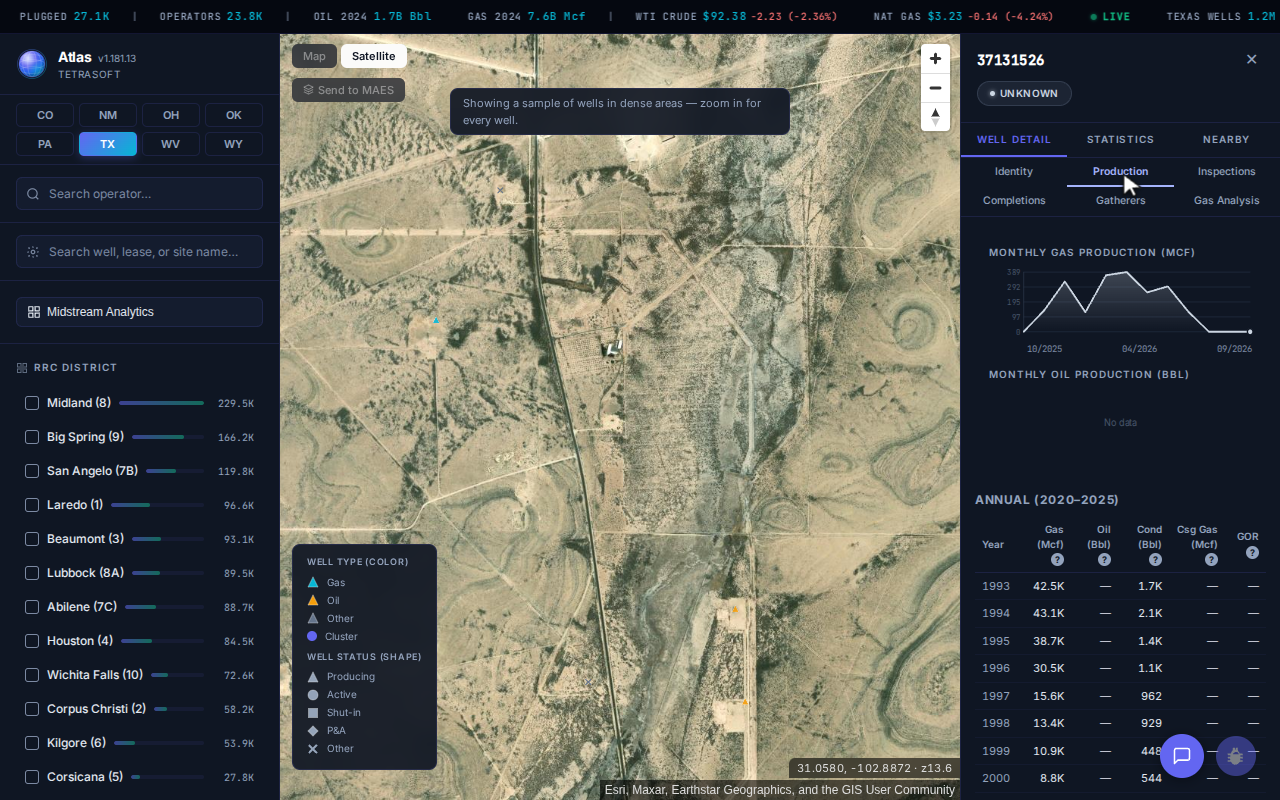
The ARCO-TERRAZAS 1 production tab: the annual table runs from 1993, with 43,092 Mcf of reported gas production in 1994. [1]
See Where the Horizontal Laterals Actually Run
A horizontal well’s surface location is not where it produces, and the map can show both ends [1]. Turn on the Atlas bottomhole lines and each lateral draws from its pad to its subsurface endpoint [1]. In the Permian core, where pads send several laterals miles in parallel, the lines show whose wells run under a tract.
An Atlas density heatmap covers the other end [1]. It shades the state by how tightly wells are packed, so the Permian and the old fields around Wichita Falls stand out before you zoom. For the field names behind those clusters, see Texas Oil Fields: 65,000 Names and Two Drilling Eras.
What TetraSoft Atlas Shows Beyond Texas Wells
TetraSoft Atlas layers the infrastructure and liabilities around Texas wells onto the same map, each one toggled from the left panel [1].
Which Pipelines and Gas Plants Surround a Texas Well?
The pipeline layer draws 480,899 segments from the Commission’s pipeline mapping data, about 358,000 miles of gathering, transmission, crude and product lines [1].
The Commission’s mapping data includes active, inactive and abandoned lines still in the ground [7]. Midstream sites add the gas plants those lines feed; the Natural Gas Pipeline Map: Lines, Operators, and Safety guide covers how the pipeline layer is built [1].
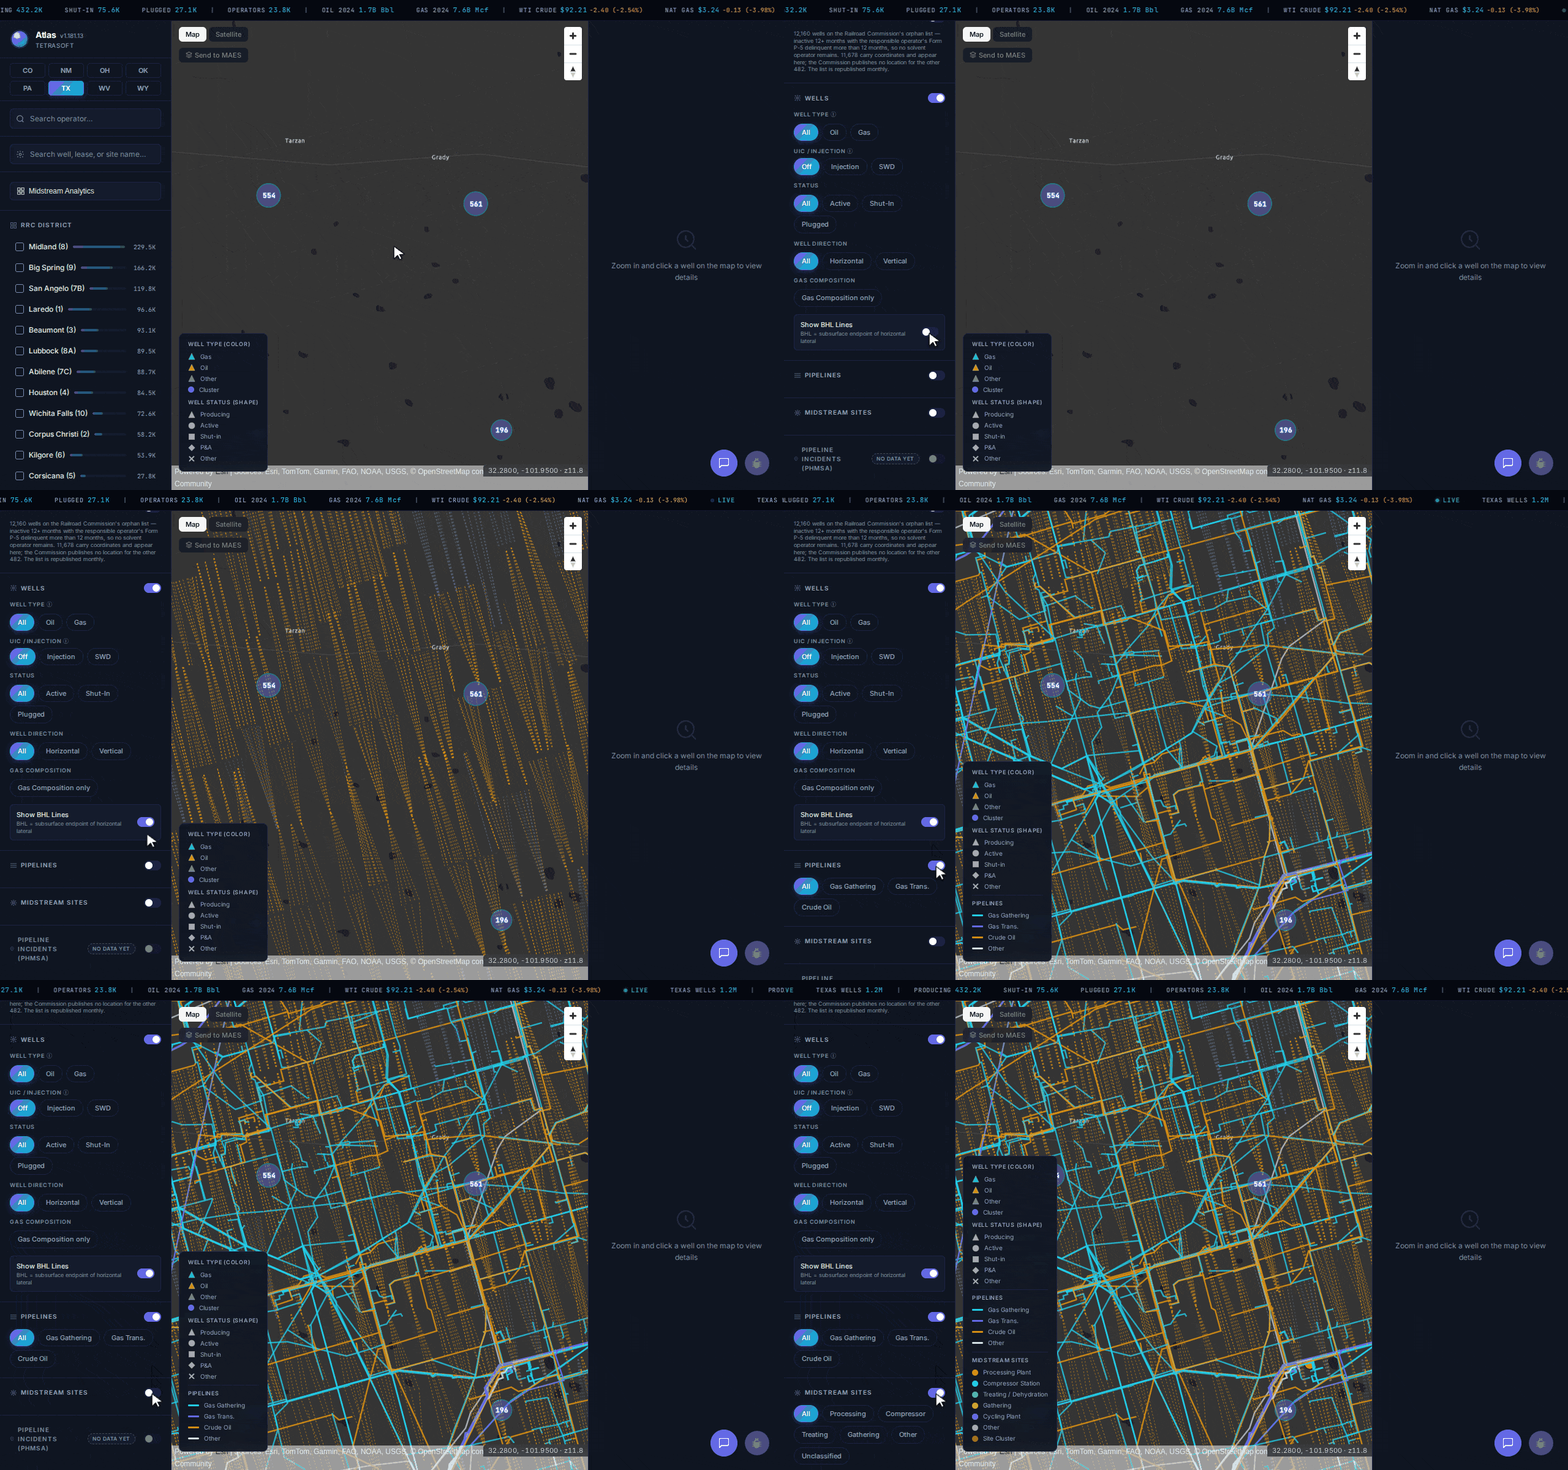
Horizontal laterals, then pipelines, then midstream sites, switched on one at a time in Atlas over the Permian core. [1]
Which Texas Wells Are on the Commission’s Orphan List?
The orphan well layer maps the Commission’s orphan list [1]. The Commission defines those as “inactive, non-compliant wells that have been inactive a minimum of 12 months.” [8] Each operator’s Form P-5 filing is also over 12 months delinquent [8].
The Commission posts the full list as a monthly Excel download [8]. The list holds 12,160 wells, and 11,678 of them carry coordinates and appear on the map [1]. The other 482 carry no coordinates in the Commission list Atlas reads, so they are not on the map [1].
Anyone checking a parcel for Abandoned Gas Wells: What They Are and Where to Find Them should read that layer alongside the inactive wells around it.
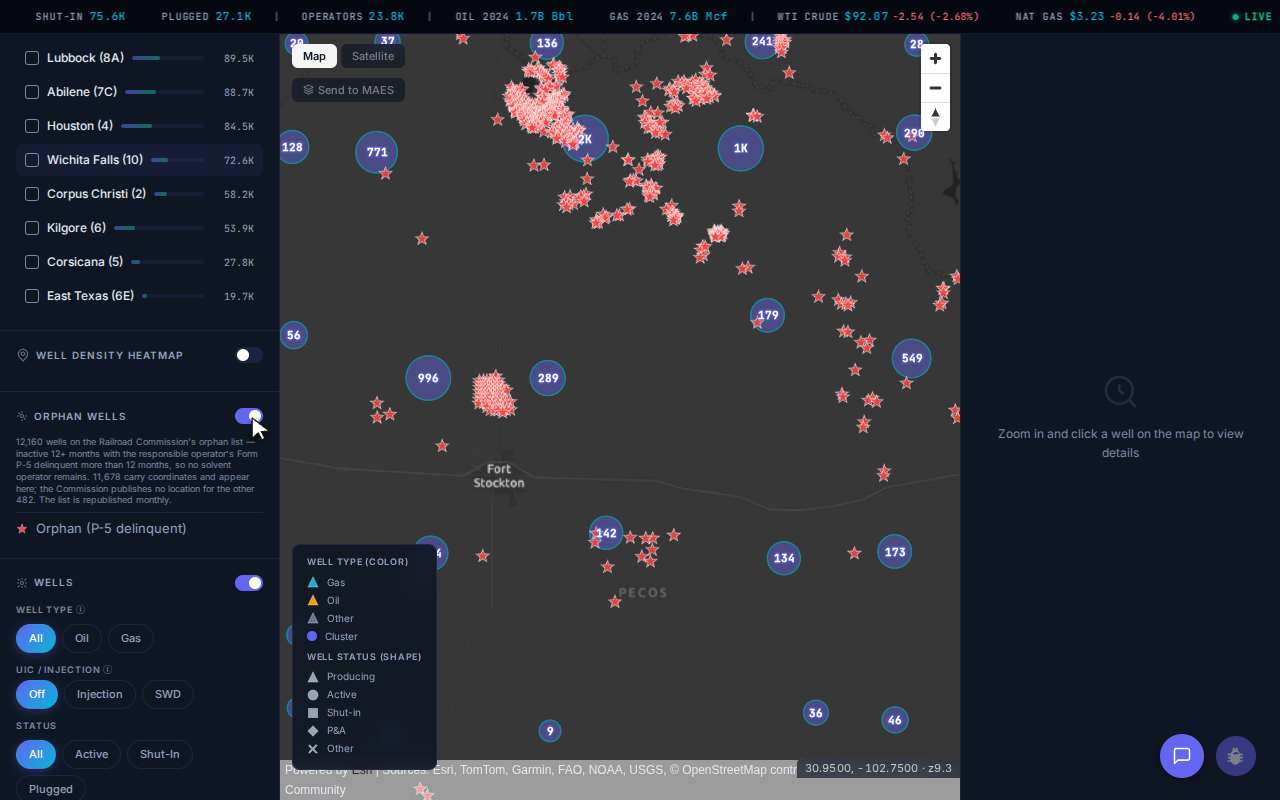
Orphan wells around Fort Stockton, Pecos County, the county with the most on the Commission’s list. [1]
The Atlas lookup below counts those orphans county by county, set against the wells each county has on record [1]. Pecos County carries 705 orphans, about 40 per 1,000 wells on record, four times the statewide rate on that basis [1]. That gap is steeper than we expected from a county with about 4,200 wells still producing.
TetraSoft Atlas vs the Free RRC GIS Viewer: Which Texas Map Fits
TetraSoft Atlas and the free Railroad Commission viewer answer different questions, and the free one leaves gathering production, inspection and gas records to you. Both draw on Commission records.
The RRC GIS Viewer: The Texas Railroad Commission Public Map carries 22 layers, and five draw on Commission records alone: wells, pipelines, restricted drilling areas, cleanup sites and alternative fuel sites [2]. The viewer searches by API number, address, survey or lease ID, and adds radius and measurement tools [9]. Production, permits and completions are separate downloads; production comes as a monthly CSV dump or as ledgers split across 14 district files [4].
| For one Texas well | TetraSoft Atlas | RRC Public GIS Viewer |
|---|---|---|
| Annual production on the well | 1993 to 2026, allocated from the lease | No, separate lease files |
| Inspection history | On the record | No, separate query |
| Completions | On the record for about 20,500 wells, most since 2020 | In the viewer’s well download, for wells inside a circle you draw |
| Gas composition | Lab samples on 3,737 wells | No |
| Gas well tests (G-10) | 38,652 wells, 1990 to 2021 (Atlas’s copy ends in 2021) | Separate download, latest 26 months |
| Orphan wells | Mapped, 11,678 wells | Separate query and list |
| Gas plants and midstream sites | Mapped layer | No |
| Well density heatmap | Yes | No |
| Wells outside Texas | Seven more states | No |
| Location, operator, status | Yes | Yes |
| Cost and account | 7-day trial with no credit card, then a subscription | RRC public service |
| The record as of today | Processed copy, refreshed weekly (as of September 2026) | Yes, the Commission’s own data |
The free viewer’s real price is your time, and by hand it grows with each well you check. Rebuilding the ARCO-TERRAZAS 1 record by hand takes a viewer search, a lease production query, an inspection lookup and a USGS gas file. The Commission’s download page puts the rest on you: “The conversion of the data and choice of conversion tools is the responsibility of the user.” [4] In Atlas, that record is one click, and fifty wells on different leases are fifty clicks, not fifty rounds of lookups.
Where a Texas Map Goes Wrong on Production
A costly mistake with Texas oil well production data is reading a lease total as one well’s output. The Commission’s FAQ on Texas RRC production data states that “in Texas, production is reported by each oil and gas lease rather than individual well.” [3] On a nine-well oil lease, the lease volume pinned to one wellbore is nine times its even share, and a valuation inherits the error.
Atlas divides the lease total evenly across the wells on the lease and shows that share [1]. The ARCO-TERRAZAS 1 is a gas well, and Texas gas leases hold one well each, so its curve above is its own [1]. For the lease mechanics in full, see RRC Wellbore Query: How to Search Texas Well Records Online.
The Commission’s PDQ system also totals production by field, operator, district or county [3]. For Texas oil production by county, the Production tab of the Atlas Midstream Analytics dashboard lists liquids and gas for the leading counties [1].
Texas is one of eight states in TetraSoft Atlas [1]. Together they produced 68 percent of US crude oil and 83 percent of US marketed natural gas in 2025 [10]. Atlas is self-serve, with no sales call required and a 7-day trial that needs no credit card [1].
Frequently Asked Questions
How many oil wells are in Texas?
The Railroad Commission monitors about 431,500 oil and gas wells, as of August 31, 2026 [11]. Counting plugged wells, about 1.2 million wellbores are on record, past and present [1].
About 1 million of them carry map coordinates, and Atlas maps them [1].
How do I look up oil well production in Texas?
The Commission’s Production Data Query reports Texas oil and gas production data by lease, from 1993 on, not by well [3]. Find the well’s lease number, then query that lease. In Atlas, the well’s production tab shows it directly, allocated from the lease [1].
How do I find oil wells on my property in Texas?
Zoom Atlas to your land on satellite imagery to see the located oil and gas wells, each with status and operator [1]. The Commission’s free viewer also takes an address or survey [9]. Treat a mapped point as approximate. For what to check next, see Oil Wells Near Me: How to Find Wells Near Your Property.
Who owns the mineral rights under my land in Texas?
Whoever your deed chain names: Texas treats minerals and surface as separate estates [12]. The Commission says it generally lacks jurisdiction here [12]. A sale that does not reserve the minerals conveys them, so your chain of title decides. The Commission advises consulting an oil and gas attorney [12].
Is there a free Texas oil and gas map?
Yes. The Railroad Commission of Texas offers its Public GIS Viewer, with wells, pipelines and survey layers, as a public service [9]. It shows where a well is, not what it produced or how it was inspected; those sit in separate Commission files [4].
What does the Railroad Commission of Texas do?
The Commission is the state agency with primary regulatory jurisdiction over the oil and natural gas industry [13]. Founded in 1891 to regulate railroads, it has since taken on many other industries [13]. Its well records are the core of a Texas oil and gas map.
How do I find a Texas well’s API number?
In TetraSoft Atlas, a well’s identity tab shows its full 10-digit API number [1]. The Commission’s own record searches take only the last eight digits: the county code and the wellbore number [5]. For each digit’s meaning, see API Well Number Lookup: What It Is and How to Read One.
How much does TetraSoft Atlas cost?
Atlas plans scale with the number of seats, and self-serve plans start with a 7-day free trial [1]. The trial needs no credit card, and no sales call is required [1]. For current plans and prices, see the Atlas pricing page [1].
You came looking for a Texas oil and gas map because a location alone does not answer your question. TetraSoft Atlas maps about 1 million located Texas wells with production and inspections one click away, re-pulled weekly from Commission records [1]. Skip the downloads and the joins, and see the whole record in your first session. Start your free 7-day trial.
This post is for informational purposes only and does not constitute legal or compliance advice. Consult qualified legal counsel or a compliance professional for guidance specific to your operations and jurisdiction.
References
- TetraSoft Atlas, Texas oil and gas dataset read September 2026. https://tetrasoftco.com/atlas-landing.html#pricing
- Railroad Commission of Texas, Public GIS Viewer Data Sources Table. https://gis.rrc.texas.gov/gisviewer/GISViewer/docs/publicVeiwerDST.pdf
- Production Data Query System (PDQ) FAQs, Railroad Commission of Texas. https://www.rrc.texas.gov/about-us/faqs/oil-gas-faq/production-data-query-system-faqs/
- Data Sets Available for Download, Railroad Commission of Texas. https://www.rrc.texas.gov/resource-center/research/data-sets-available-for-download/
- Well Records FAQs, Railroad Commission of Texas. https://www.rrc.texas.gov/about-us/faqs/oil-gas-faq/well-records-faqs/
- U.S. Geological Survey, Natural Gas Compositional Analyses Dataset of Gases from United States Wells, 2021. Brennan, S.T., Rivera, J.L., Creitz, R.H., Varela, B., and Park, A.J., U.S. Geological Survey data release. https://doi.org/10.5066/P9TR93E3
- Pipeline Mapping, Railroad Commission of Texas. https://www.rrc.texas.gov/pipeline-safety/mapping/
- Orphan Wells with Delinquent P-5 Greater Than 12 Months, Railroad Commission of Texas. https://www.rrc.texas.gov/oil-and-gas/research-and-statistics/well-information/orphan-wells-12-months/
- Public GIS Viewer (Map), RRC Resource Center. https://www.rrc.texas.gov/resource-center/research/gis-viewer/
- U.S. Energy Information Administration, crude oil and natural gas marketed production by state, annual 2025, accessed September 23, 2026. https://www.eia.gov/dnav/pet/pet_crd_crpdn_adc_mbbl_a.htm; https://www.eia.gov/dnav/ng/ng_prod_sum_a_EPG0_VGM_mmcf_a.htm
- Wells Monitored by the Railroad Commission, August 31, 2026, Railroad Commission of Texas. https://www.rrc.texas.gov/media/pp4jbxif/august-2026.pdf
- Oil and Gas Exploration and Surface Ownership FAQ, Railroad Commission of Texas. https://www.rrc.texas.gov/about-us/faqs/oil-gas-faq/oil-gas-exploration-and-surface-ownership/
- About Us, Railroad Commission of Texas. https://www.rrc.texas.gov/about-us/
Interactive tool
Texas county well and orphan lookup
Pick a county to see its wells on Railroad Commission record and how many sit on the Commission's orphan well list: wells inactive 12 months or more whose operator's Form P-5 has been delinquent for over 12 months.
All 254 Texas counties
Orphan wells per 1,000 wells in Pecos County
40.2
4.0x the statewide 10.1 per 1,000 wells.
- Wells on record
- 17,538
- Producing
- 6,004
- Oil wells
- 9,637
- Gas wells
- 2,422
- Orphan wells
- 705
- RRC district
- 08
TetraSoft Atlas count of Railroad Commission of Texas well records and the Commission's orphan well list, September 2026, placed by the county code in each API number. 862 wells and 99 orphans sit in offshore areas and are in no county's count. District is the one most of the county's wells carry. Nothing leaves your browser.
Comments
0Share your thoughts. All comments are moderated before appearing.
No comments yet. Be the first to share your thoughts!