Screening a site for a setback, a lease or an acquisition starts with a well coordinate. That coordinate is probably not where the well produces, and finding it means logging into a different system for every state you work in. Oil well locations are published by the state agency that permitted the well, as a latitude and longitude attached to an API number.
TetraSoft Atlas is our subscription platform, joining well, production, emissions and enforcement records on one map [1]. Across the eight states it covers there are 2,701,551 wells on record [2]. They are Texas, Oklahoma, Pennsylvania, Ohio, West Virginia, New Mexico, Colorado and Wyoming [1]. The coordinate almost always describes the surface point, meaning where the rig sat, which for a horizontal well is not where the oil is.
Across the five states that publish both ends, the producing end sits a median 607 to 2,640 meters from the surface point [3]. This is the hub page for well locations. It covers where each state publishes them, how accurate they are, and which end of the well they describe. It then covers what the record leaves out, and what holding all eight states at once takes.
Quick Answer: Oil well locations live in one state system per state, joined by the API number. The eight states are the ones TetraSoft Atlas covers [1]. Those eight states hold 2,701,551 wells [2]. The published coordinate is the surface location, not the producing interval. Five of the eight publish a bottomhole as well, and in Texas the median gap between the two is 1,601 meters [3]. In Colorado, 56 percent of wells carrying both coordinates have a bottomhole more than 500 meters from the surface point [4].
On this page
- Where Oil Well Locations Are Published, State by State
- How Accurate Is a Published Well Coordinate?
- A Well Has More Than One Location
- Every State’s Well Search, and What Each One Will Not Do
- What a Location Record Does Not Tell You
- What TetraSoft Atlas Does With Eight States of Well Locations
Where Oil Well Locations Are Published, State by State
Each state runs its own well record system, so there is no national well location file to download. The eight states below carry the large majority of United States oil and gas wells, and each publishes its own coordinates in its own format [2].
| State | Agency | Where the locations are published | Wells on record |
|---|---|---|---|
| Texas | Railroad Commission of Texas | Public GIS Viewer | 1,215,178 |
| Oklahoma | Oklahoma Corporation Commission | Well Data Finder | 458,693 |
| Pennsylvania | Pennsylvania DEP | PA Oil and Gas Mapping | 279,480 |
| Ohio | Ohio DNR | Well Locator | 242,379 |
| West Virginia | West Virginia DEP | Oil and Gas Well Information | 167,816 |
| New Mexico | New Mexico OCD | OCD well search | 142,553 |
| Colorado | Colorado ECMC | COGIS Facility Search | 125,717 |
| Wyoming | Wyoming OGCC | WOGCC Active Wells (Wyoming Geospatial Hub) | 69,735 |
Well counts from the TetraSoft Atlas canonical dataset, September 2026.
Texas alone is roughly 45 percent of that total [2]. A search that covers only the state you work in will miss operators who cross a border, which most large ones do. The eight-state picture, agency by agency, is set out in Oil and Gas Well Map: 2.7M Wells Across Eight States.
The API Number Is What Lets Two Records Meet
The API well number is the only identifier that survives a move between state systems. State-assigned permit numbers, facility identifiers and operator codes are local to the agency that issued them. Anyone joining locations across states is joining on the API number or is guessing.
How the number is built, and what each segment means, is set out in API Well Number Lookup: What It Is and How to Read One. Atlas keys every one of its 2,701,551 wells on that number, which is what lets an operator’s Texas and New Mexico wells answer one query [2].
How Accurate Is a Published Well Coordinate?
A published coordinate is as accurate as the method that produced it, which is often not a measurement. The agencies say so themselves, in metadata most users never open. Two dots on the same screen can carry accuracies produced decades and methods apart.
The Agencies State Their Own Limits
State agencies describe the accuracy and currency of their own coordinates in their metadata, which carries more weight than our reading of their data. The Illinois State Geological Survey publishes location points for “over 580,000 wells and borings, some dating back to 1801 (assumed.)” [5] Of those it says plainly: “Most locations have not been field verified.” [5] Its accuracy statement is more specific still.
The survey puts it this way: “The stated accuracy is +/- 100 feet, however some points may be inaccurate by as much as one mile.” [5] It attributes the worst case to “irregularities in the Illinois PLSS and associated descriptions.” [5] The cause is how a location was derived rather than how precisely it was measured.
Illinois notes that “Most commonly, the location is derived by converting a legal… description to a point location.” [5] The legal description is a Public Land Survey System description [5]. Where the description names only a section or quarter-section, the point is placed at that area’s center [5]. A dot can therefore be the middle of a square mile.
Texas states its position on its own GIS data equally directly. The Railroad Commission writes that its data “is intended solely for the internal use of the Railroad Commission.” [6] The same sentence adds that the agency “makes no claim as to its accuracy or completeness.” [6] That is a disclaimer, not a defect report, and it applies to the largest well register in the country.
Colorado’s break point is a date, which makes it easy to check. Before then the state read “Footage calls from section lines” with “an AutoCAD program that uses a 1:24,000 digital land grid for the base map.” [7] Wells were spotted “as perpendicular offsets to section lines or as the center of a quarter quarter” before the coordinates were computed [7]. The agency then records the change: “As of December 1, 2005, all new well permits are submitted to the COGCC with GPS latitudes and longitudes.” [7]
Nearly Half of Colorado’s Recorded Locations Are Planned, Not Surveyed
Of the 124,258 Colorado wells carrying a location-quality flag, 44.8 percent are marked planned rather than actual [4]. Colorado tags each location with that flag, which records whether anyone measured it [4]. A planned location is where the operator said the well would go.
That number stopped me. Nothing in a coordinate pair signals which kind it is. The two look identical in a spreadsheet, a map layer and a proximity query.
Colorado is unusual in publishing the flag at all, which means the same uncertainty is present and invisible elsewhere. Atlas keeps each agency’s own quality fields rather than flattening them into one tidy coordinate [1]. The flag is the only thing that tells you which kind you have.
Old Coordinates May Sit on an Older Datum
A latitude and longitude means nothing without the datum it was measured against. Records originating before the 1990s commonly sit on NAD27, while modern data uses NAD83 or WGS84 [8]. The USGS puts the size of that difference at “in the range of 10-100 ground meters” within the conterminous 48 states [8]. Converting between them is a solved problem, and the National Geodetic Survey publishes NADCON to do it [9].
The failure is not the conversion but the assumption that none is needed. A well plotted on the wrong datum lands tens of meters from where it is, silently. Atlas reprojects all eight registers onto one datum before they are ever drawn together [1]. That step sits between the agency file and the map.
A Well Has More Than One Location
A directional well has a surface location and a bottomhole location, and the published coordinate is usually the first. The distance between them is not a rounding error [4]. Five of the eight states carry both ends: Colorado, Texas, Oklahoma, Ohio and West Virginia [1]. Colorado is distinctive only in publishing the bottomhole depth alongside its position [1].
Among the 29,516 Colorado wells carrying both coordinates, the bottomhole sits a median 607 meters from the surface point [4]. The ninetieth percentile is 3,076 meters [4]. Colorado is also the smallest gap of the five, which makes it the least alarming case rather than the representative one.
| State | Wells with both ends | Median surface to bottomhole | Share over 500 m |
|---|---|---|---|
| Colorado | 29,516 | 607 m | 56% |
| Texas | 173,745 | 1,601 m | 83% |
| Oklahoma | 8,548 | 2,191 m | 85% |
| Ohio | 5,109 | 2,554 m | 87% |
| West Virginia | 5,531 | 2,640 m | 99% |
Straight-line displacement between the published surface point and the published bottomhole, for wells carrying both. [3]
West Virginia is the case that should decide how you treat a surface coordinate. There, 99 percent of wells with both ends have a producing interval more than 500 meters from the dot [3]. Roughly 27 percent of the Colorado wells clear a full mile [4].
Atlas draws both ends wherever the state publishes them [1]. The gap is then visible on the map rather than something you have to remember to allow for.
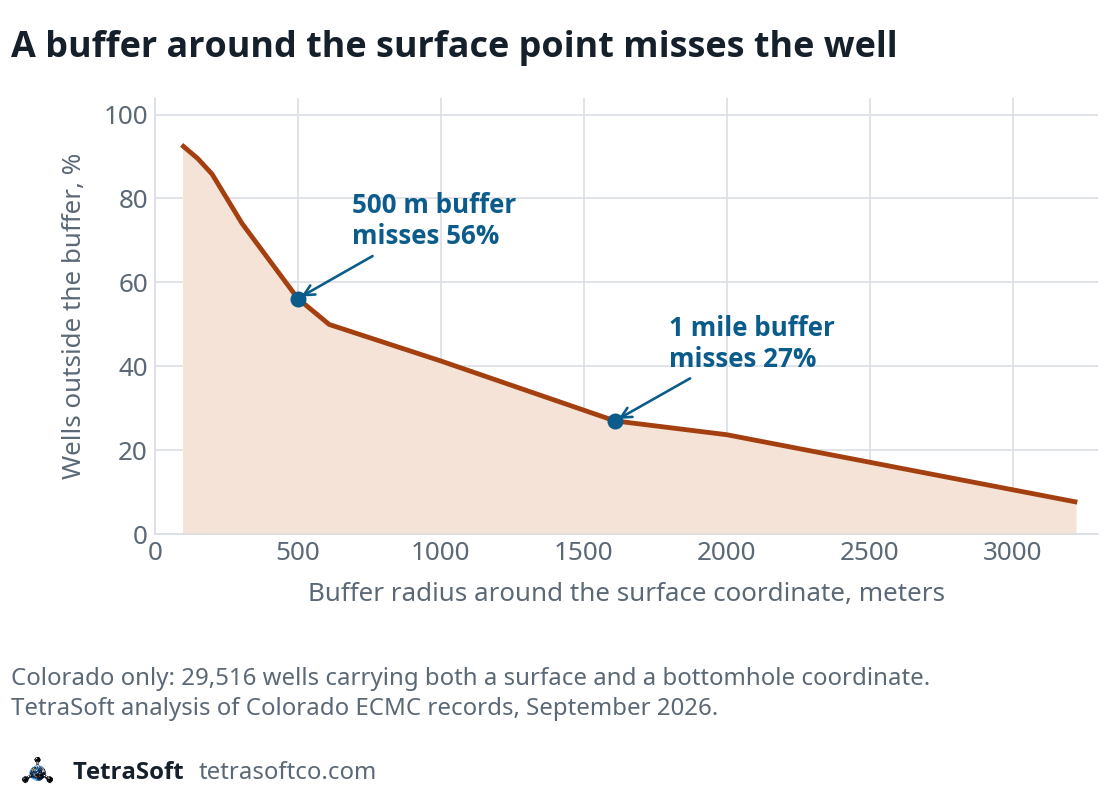
Share of 29,516 Colorado wells carrying both coordinates whose bottomhole falls outside a buffer around the surface point. TetraSoft analysis of ECMC records, September 2026.
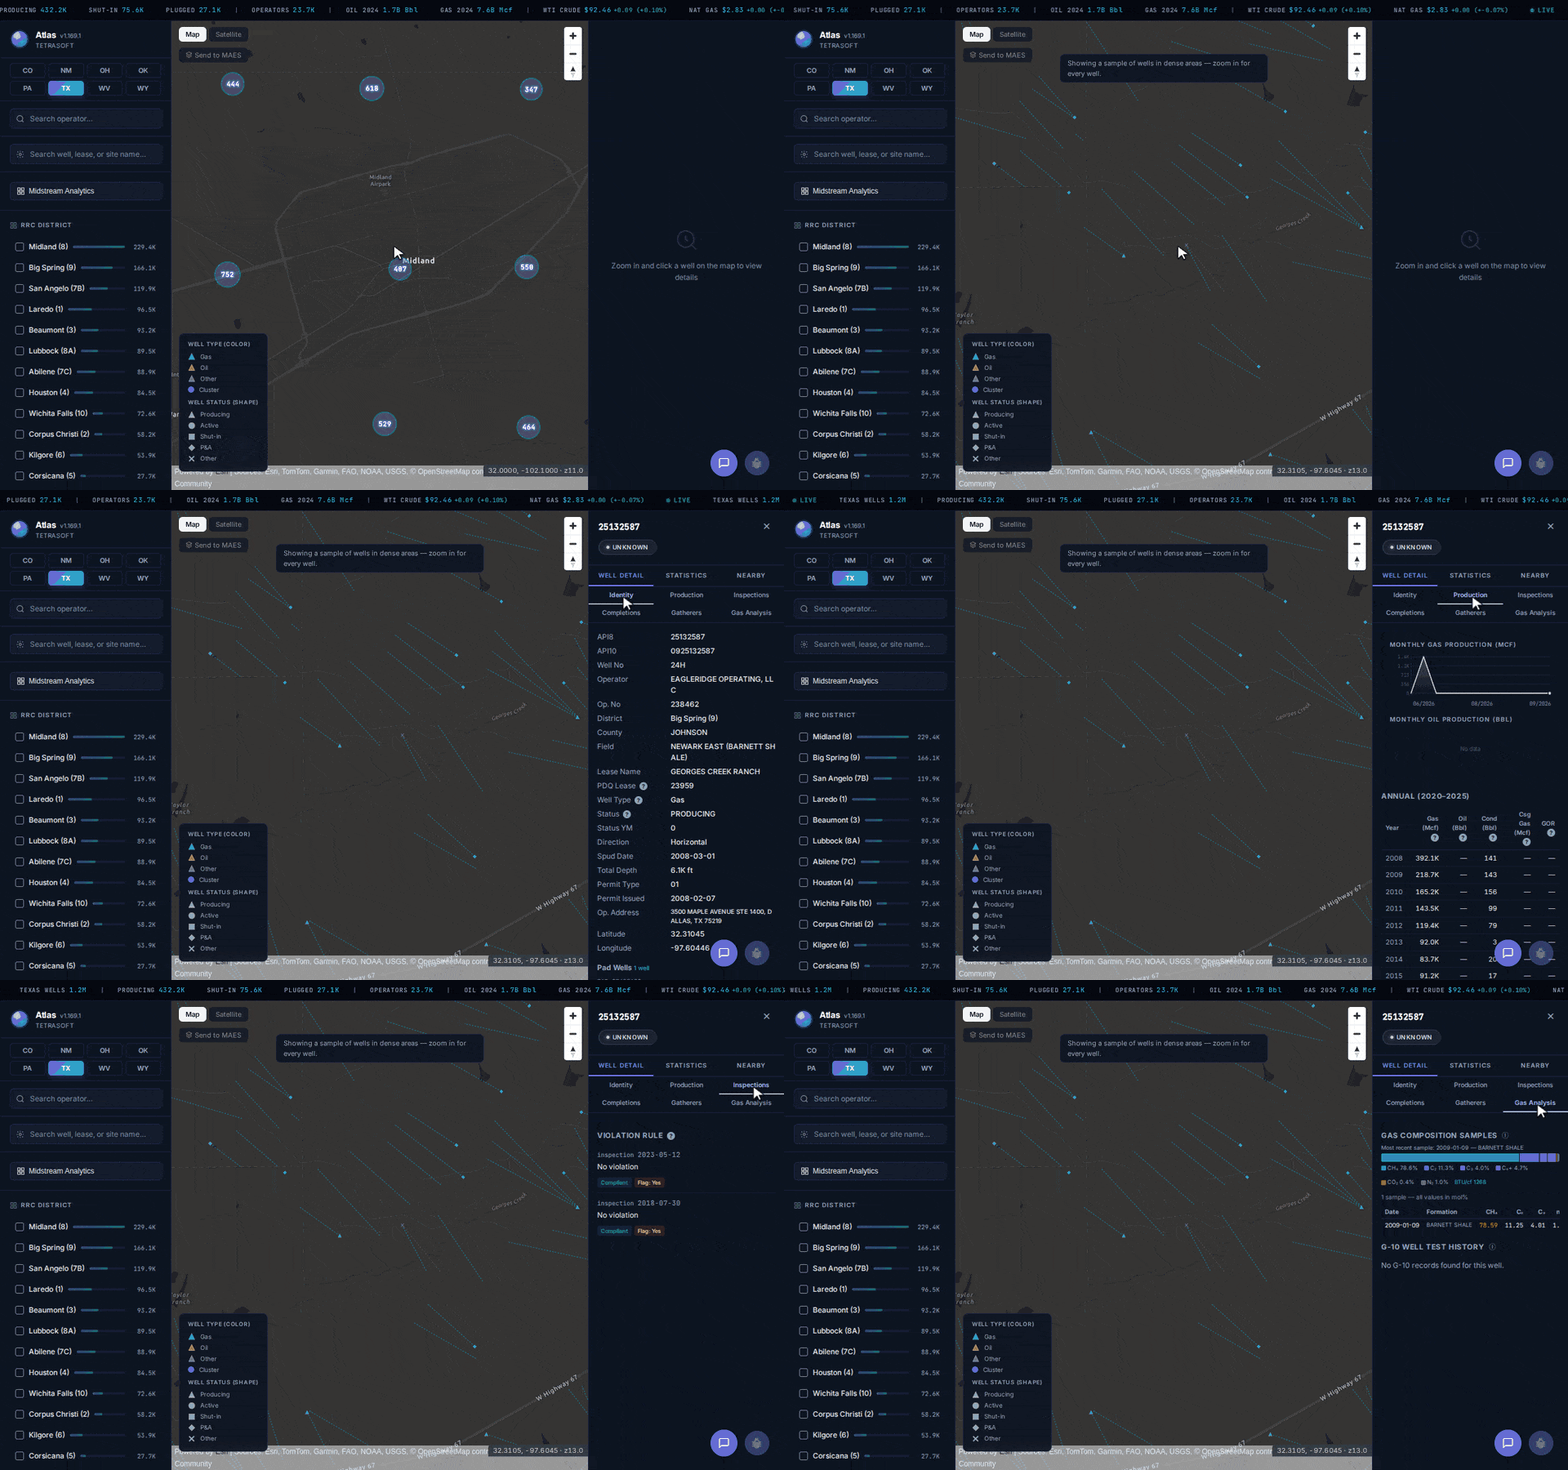
Atlas drawing the same view with and without bottomhole locations, then one well’s own record. TetraSoft Atlas, September 2026.
Toggling those lines on is the fastest way to see how little a surface dot commits to. The same panel then carries the well’s production, inspections and gas composition, which is the part no state portal puts beside the coordinate [1].
Every State’s Well Search, and What Each One Will Not Do
Every agency search answers questions about its own state and refuses the ones that cross a border. That is the structural limit, not an interface complaint, and it is why an operator working two basins keeps two or three tabs open. Each tool has its own walkthrough below, because what each one indexes and what it will export differ enough to matter.
| State | Agency tool, and how to drive it | Which end of the well it publishes |
|---|---|---|
| Texas | RRC GIS Viewer and RRC Wellbore Query | Surface and bottomhole |
| Oklahoma | OCC Well Data Finder | Surface and bottomhole |
| Pennsylvania | PA DEP Oil and Gas Mapping | Surface only |
| Ohio | ODNR Well Locator | Surface and bottomhole |
| West Virginia | WVDEP well search | Surface and bottomhole |
| New Mexico | NMOCD Well Search | Surface only |
| Colorado | ECMC well and permit search | Surface, bottomhole and depth |
| Wyoming | WOGCC Well Search | Surface only |
Which coordinates each agency publishes, from the TetraSoft Atlas canonical dataset, September 2026. [1]
Texas splits the job across two systems, which is the one case where the map and the records answer different questions [6]. Three states also publish a second, richer view worth knowing about. Colorado’s full data catalogue is covered in COGCC (Now ECMC) Oil & Gas Data: Maps, Permits, Wells.
Ohio’s combined permit and production map is covered in Ohio Oil & Gas Well Map: Permits, Production, Inspections, and New Mexico’s permit pipeline in NMOCD Permitting: Find and Map New Mexico Drilling Permits. Colorado’s emissions and enforcement layers are covered separately in Colorado Oil & Gas Map: Emissions and Enforcement Data.
None of these eight will answer a question about the other seven. That is the gap Atlas exists to close, and it is worth being precise about what closing it involves.
A coordinate is the cheapest part of a location question, and the part most likely to be wrong about where a well actually produces. TetraSoft Atlas draws both ends wherever the state publishes them. [1]
What a Location Record Does Not Tell You
A coordinate answers where, and almost nothing else a screening question needs. Status, subsurface geometry, what the well now does, what runs past it and who owns the revenue all sit in different records. A location search that stops at the dot has answered the easy part.
Status is the one most often mistaken for location. A plugged well keeps its coordinates. Status vocabularies differ by state, so one status word does not mean the same thing in two registers. Which wells are genuinely abandoned, and where the orphan inventories are published, is covered in Abandoned Gas Wells: What They Are and Where to Find Them.
The subsurface record is separate again. What the well actually encountered is in its logs, and where to find them is covered in Well Log Lookup: Find Logs for Any US Oil or Gas Well. A well’s field assignment is a separate lookup, set out in Oil Field Map: How to Find Any Named Field’s Wells, and the Texas field inventory specifically in Texas Oil Fields: 65,000 Names and Two Drilling Eras.
Injection and disposal wells sit under a different program with its own permits [1]. The classes and where each is published are covered in UIC Well Classes: Class II, Class VI, and Where to Look. The disposal inventory is covered in Saltwater Disposal Wells: How Many, and Where to Find Them, and the seismicity it is measured against in Oklahoma Earthquake Map: 28,000 Events and What Drives Them.
What runs past a site matters as much as what sits on it for a routing or offtake question. Gathering and transmission lines are covered in Natural Gas Pipeline Map: Lines, Operators, and Safety. Ownership is a register of its own, and how a revenue interest is checked is set out in Division Order: What It Is and How to Check the Decimal.
What TetraSoft Atlas Does With Eight States of Well Locations
TetraSoft Atlas holds all 2,701,551 wells from the eight states on one map [2], searchable by operator in every state and by API number in Texas. A well location is a reconciliation problem rather than a lookup, because eight agencies publish separately and share one identifier and nothing else. Selecting a well opens its production history, gas composition, emissions and enforcement record in the same panel [1]. The dot is the entry point rather than the answer.
That is the part eight separate portals cannot do at any level of effort. An operator search returns that operator’s wells state by state, all on one datum and keyed on the API number [1]. Each agency’s own status vocabulary and quality flags are preserved [1]. The registers are refreshed on each state’s own cycle and every figure stays attributed to the agency that filed it [1].
Atlas carries the bottomhole wherever the agency publishes one, which is five of its eight states [1]. In Wyoming, New Mexico and Pennsylvania the agencies release only the surface point, so that is what any tool can show. The coordinate you get in those three is a surface point.
A proximity screen run against the wrong end of the well returns a clean answer that is wrong. Within that boundary the reconciliation is the product.
Frequently Asked Questions
Is there one national database of oil well locations?
No, and the absence is structural rather than a gap someone forgot to fill. Locations are filed with the agency that permitted the well, in that agency’s own format and on its own schedule. The API number is the identifier that travels between them.
Why do two sources disagree about where the same well is?
Three causes account for most of it. One source may carry the surface location while the other carries the bottomhole. One may be a planned location filed with a permit rather than a surveyed one, which describes 44.8 percent of flagged Colorado records [4]. And an older record may sit on NAD27 rather than NAD83 [8].
Which states publish a bottomhole location?
Five of the eight states TetraSoft Atlas covers publish both ends of the well [1]. They are Colorado, Texas, Oklahoma, Ohio and West Virginia [1]. Wyoming, New Mexico and Pennsylvania publish the surface point only, so for a well in those three no tool can show you the producing end.
Can I trust a well coordinate for a setback or proximity screen?
Only once you know which end of the well it describes. A buffer around a surface coordinate misses the producing interval of most Colorado directional wells [4]. At 500 meters it misses 56 percent of them, and at a mile it still misses 27 percent [4].
What should I do if I only have a surface coordinate?
Widen the buffer by the state’s own median displacement before concluding anything. In Texas that median is 1,601 meters, so a 500 meter screen run on surface points is answering a different question [3]. Then check the directional survey for the wells that fall inside the widened buffer.
Does a plugged well still appear with a location?
Yes, and that is usually what you want. A plugged and abandoned well keeps its API number and its recorded coordinates. Its status field is what changes, so filtering on status rather than on presence is the way to separate active wells from historical ones.
References
- TetraSoft Atlas, multi-state well and operator dataset. https://www.tetrasoftco.com/atlas-landing.html
- TetraSoft Atlas, multi-state well and operator dataset, total and per-state well counts as of September 2026. Counts change as state agencies publish new records. https://www.tetrasoftco.com/atlas-landing.html
- TetraSoft analysis of state well records, September 2026. Surface and bottomhole coordinates as published by the Railroad Commission of Texas, Oklahoma Corporation Commission, Ohio DNR, West Virginia DEP and Colorado ECMC.
- TetraSoft analysis of Colorado Energy and Carbon Management Commission (ECMC, formerly COGCC) well records, September 2026. Surface and bottomhole coordinates and location-quality flags as published by ECMC.
- Illinois State Geological Survey. Location Points from the ISGS Wells and Borings Database. https://clearinghouse.isgs.illinois.edu/data/geology/location-points-isgs-wells-and-borings-database
- Railroad Commission of Texas. Digital Map Information GIS Data, general FAQ. https://www.rrc.texas.gov/about-us/faqs/general-faq/digital-map-information-gis-data/
- Colorado Energy and Carbon Management Commission. WELLS shapefile metadata, Data Quality Information and Lineage. https://ecmc.state.co.us/documents/data/downloads/gis/metadata/Wells_Metadata.html
- U.S. Geological Survey. How large is the North American Datum of 1927 (NAD 27) to NAD 83 shift? https://www.usgs.gov/faqs/how-large-north-american-datum-1927-nad-27-nad-83-shift
- U.S. National Geodetic Survey. NADCON: North American Datum Conversion. https://geodesy.noaa.gov/TOOLS/Nadcon/Nadcon.shtml
Interactive tool
Well buffer checker
A well coordinate is the surface point. Enter the search radius you would draw around it, and this returns the share of Colorado wells whose producing end falls outside that circle.
Bottomholes outside the buffer
74.0%
of wells at 1,000 feet
- A 1,000 feet buffer leaves 74.0 percent of bottomholes outside it.
- That is 21,848 of 29,516 Colorado wells carrying both coordinates.
- Radius in meters
- 305 m
- Wells outside, of 29,516
- 21,848
- Wells captured
- 26.0%
- Median offset in the sample
- 607 m
Colorado only. It is the one state of the eight in this dataset that publishes a bottomhole coordinate, so it is the only place the offset can be measured. A basin with different well design has a different curve.
TetraSoft analysis of Colorado ECMC well records, September 2026. Screening aid for choosing a search radius, not a substitute for a well's own bottomhole coordinate.
Comments
0Share your thoughts. All comments are moderated before appearing.
No comments yet. Be the first to share your thoughts!